


EUR/USD TECHNICAL ANALYSIS: BEARISH
- Euro surges to 4-month high but struggles to break range top
- Negative RSI divergence hints rally may reverse course soon
- Reversal confirmation needs break of 2-week trend support
Get help building confidence in your EUR/USD strategy with our free trading guide!
The Euro is testing the top of the range confining price action since mid-October in the 1.1176-83 area. A break higher confirmed on a daily closing basis may set the stage for a push beyond the 1.13 figure, with a minor barrier at 1.1348 lining up thereafter on route to the late June high of 1.1412.
Immediate support is marked by a rising trend line connecting swing lows defining the upswing from the October 29 low, now at 1.1094. A reversal back below that opens the door for another challenge of support in the 1.0968-90 congestion area.
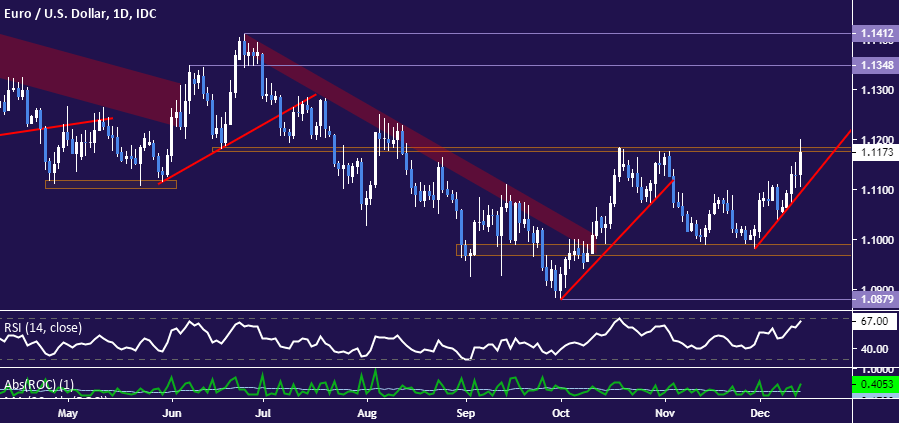
Daily EUR/USD chart created with TradingView
Near-term positioning suggests the upside foray may be repelled. The four-hour chart shows EUR/USD stalling at double top resistance as negative RSI divergence points to ebbing upside momentum. That might be laying the groundwork for a reversal downward.
Any weakness that follows from here will need to conclusively clear two-week uptrend support to make a convincing case for bearish follow-through, even in the near term. The long side seems no more attractive however – at least for now – as prices’ proximity to resistance speaks to adverse risk/reward parameters.

4-hour EUR/USD chart created with TradingView
| Change in | Longs | Shorts | OI |
| Daily | -1% | -4% | -3% |
| Weekly | 4% | -10% | -5% |
EUR/USD TRADING RESOURCES
- Just getting started? See our beginners’ guide for FX traders
- Having trouble with your strategy? Here’s the #1 mistake that traders make
- Join a free webinar and have your questions answered
--- Written by Ilya Spivak, Currency Strategist for DailyFX.com
To contact Ilya, use the comments section below or @IlyaSpivak on Twitter


