


EUR/USD TECHNICAL ANALYSIS: BEARISH
- Euro breaks 4-month resistance, opening the door for an upswing
- Dominant trend likely to remain bearish through corrective gains
- Monthly chart warns the Euro is on pace to revisit two-year lows
Get help building confidence in your EUR/USD strategy with our free trading guide!
The Euro has broken falling trend line resistance guiding it lower against the US Dollar since late June, suggesting a correction higher is afoot. From here, a daily close above the 38.2% Fibonacci retracement at 1.1083 opens the door for a test of the 50% level at 1.1146.
Breaking below counter-trend support set from the October 1 low looks to be a minimum pre-requisite to reengaging the downtrend. A daily close below that as well as resistance-turned-support at the just-broken trend line sets the stage to challenge the monthly low at 1.0879 once again.

Daily EURUSD chart created in TradingView
All the same, the dominant trend bias continues to look decidedly bearish. A look at the weekly chart shows prices locked in a well-defined descent for the past 16 months. Invaliding that calls for a break north of that move’s upper boundary, now just a hair below the 1.13 figure.
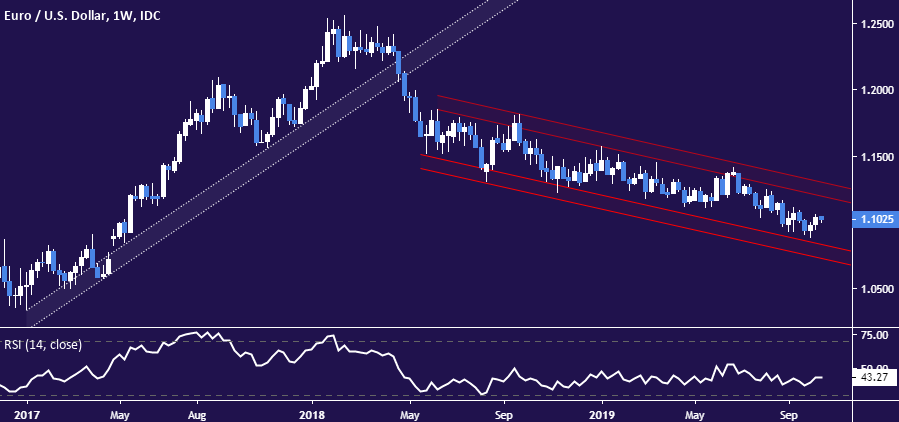
Weekly EURUSD chart created in TradingView
The monthly chart looks still more ominous. It seems to show the Euro poised to prolong what has been a more than decade-long decline. Prices finished September with a break of the multi-year price inflection barrier at 1.0980. That seems to set the stage for a test of the 1.0459-1.0563 zone in the months ahead.
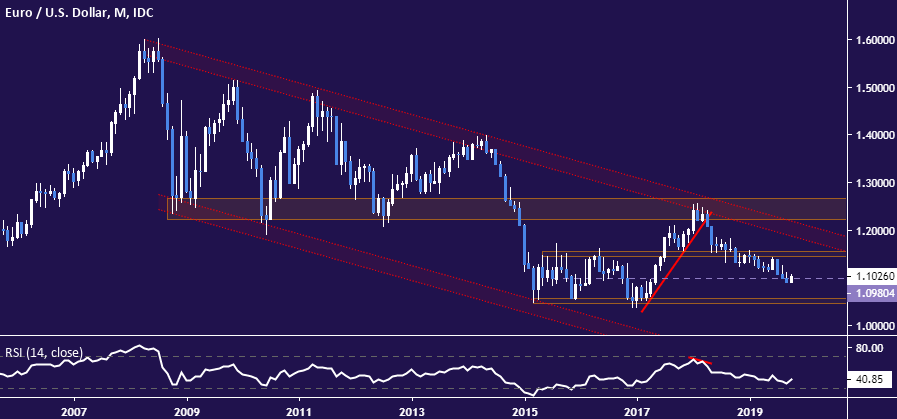
Monthly EURUSD chart created in TradingView
EUR/USD TRADING RESOURCES
- Just getting started? See our beginners’ guide for FX traders
- Having trouble with your strategy? Here’s the #1 mistake that traders make
- Join a free webinar and have your questions answered
--- Written by Ilya Spivak, Currency Strategist for DailyFX.com
To contact Ilya, use the comments section below or @IlyaSpivak on Twitter


