


EUR vs JPY Technical Outlook
- Bulls momentum eased up, but the bias higher remained
- Positive outlook while above 125.80
EUR/JPY Price – Indecisive Traders
Last week, EUR/JPY hit an over 15-months high at 125.59. However, the price retreated after as some bulls seemed to cut back. Ultimately, a weekly candlestick closed a Doji pattern highlighting the market’s indecision.
Alongside that, the Relative Strength Index (RSI) abandoned overbought territory and fell to 61 reflecting that bulls were losing momentum.
EUR/JPY Daily PRice CHART (SEPTEMBER 1, 2018 – August 12, 2020) Zoomed Out
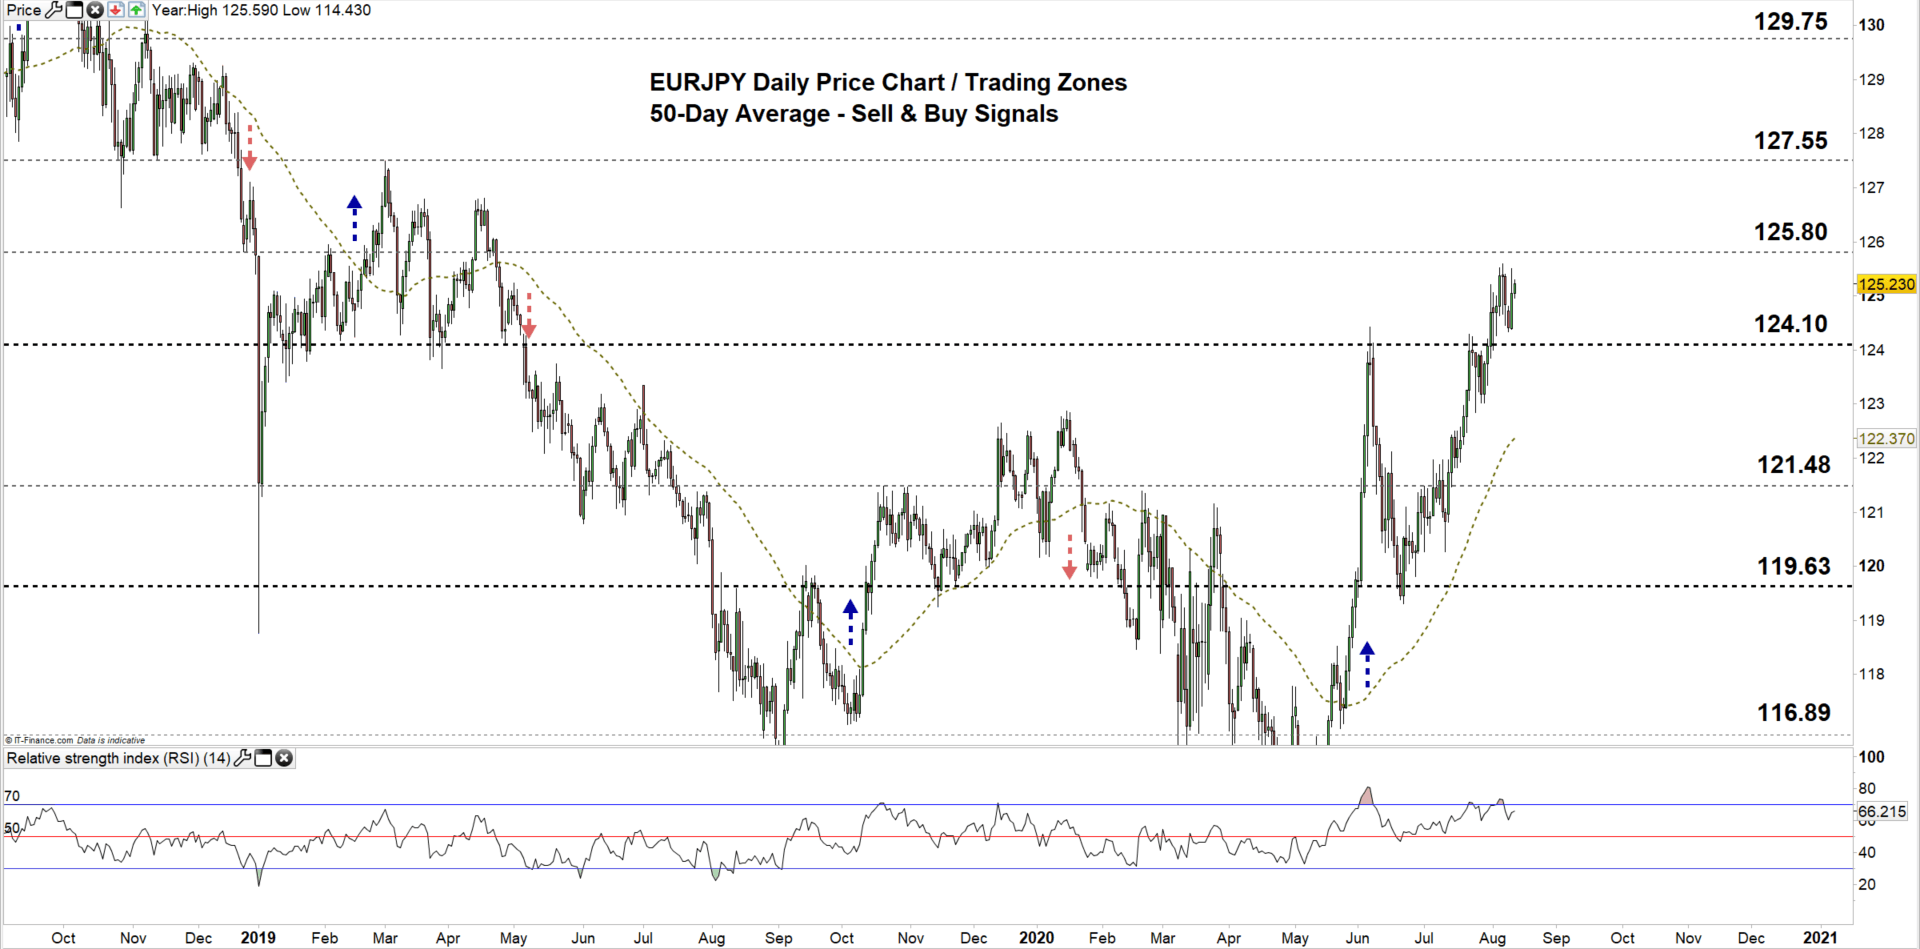

EUR/JPY Daily Price CHART (April 29 – August 12, 2020) Zoomed in

By the end of July, EUR/JPY rallied to the current 124.10 -125.80 trading zone reflecting that bulls had the upper hand.
However, it’s important to note the price and RSI divergence as the former created a higher high, while the latter created a lower high, signaling a possible reversal of the upward trend.
A close above the high end of the zone could encourage bulls to extend the rally towards the monthly resistance level at 127.55 ( November 2018 low).
On the other hand, a failure in closing above the high end of the zone could reverse the pair’s direction towards the low end of the zone ( December 2016 high).

EUR/JPY Four Hour Price CHART (July 29 – AUgust 12, 2020)

On August 7, EUR/JPY broke below the bullish trendline support originated from the July 29 low at 123.01. Today, the price tests breaking above the same trendline hence, another failure in breaking above the line reflects a weaker bullish sentiment.
To conclude, while bullish bias is still in place a price/RSI divergence provides a good base of a possible reversal on the horizon. Therefore, a break below 123.79 could send EURJPY towards 122.84, while a break above 126.08 may trigger a rally towards the 127.55. As such, the daily support and resistance levels marked on the four-hour chart should be monitored.
Written By: Mahmoud Alkudsi, Market Analyst
Please feel free to contact me on Twitter: @Malkudsi


