


EUR vs JPY Technical Outlook
EUR/JPY Price- A Multi-Month High
Last week, EUR/JPY hit a near 15-month high of 125.21. However, the price retreated after as some bulls seemed to cut back. Ultimately, a weekly candlestick closed in the green with a 0.8% gain.
Alongside that, the Relative Strength Index (RSI) rose from 57 to 70 indicating an accelerated bullish momentum.
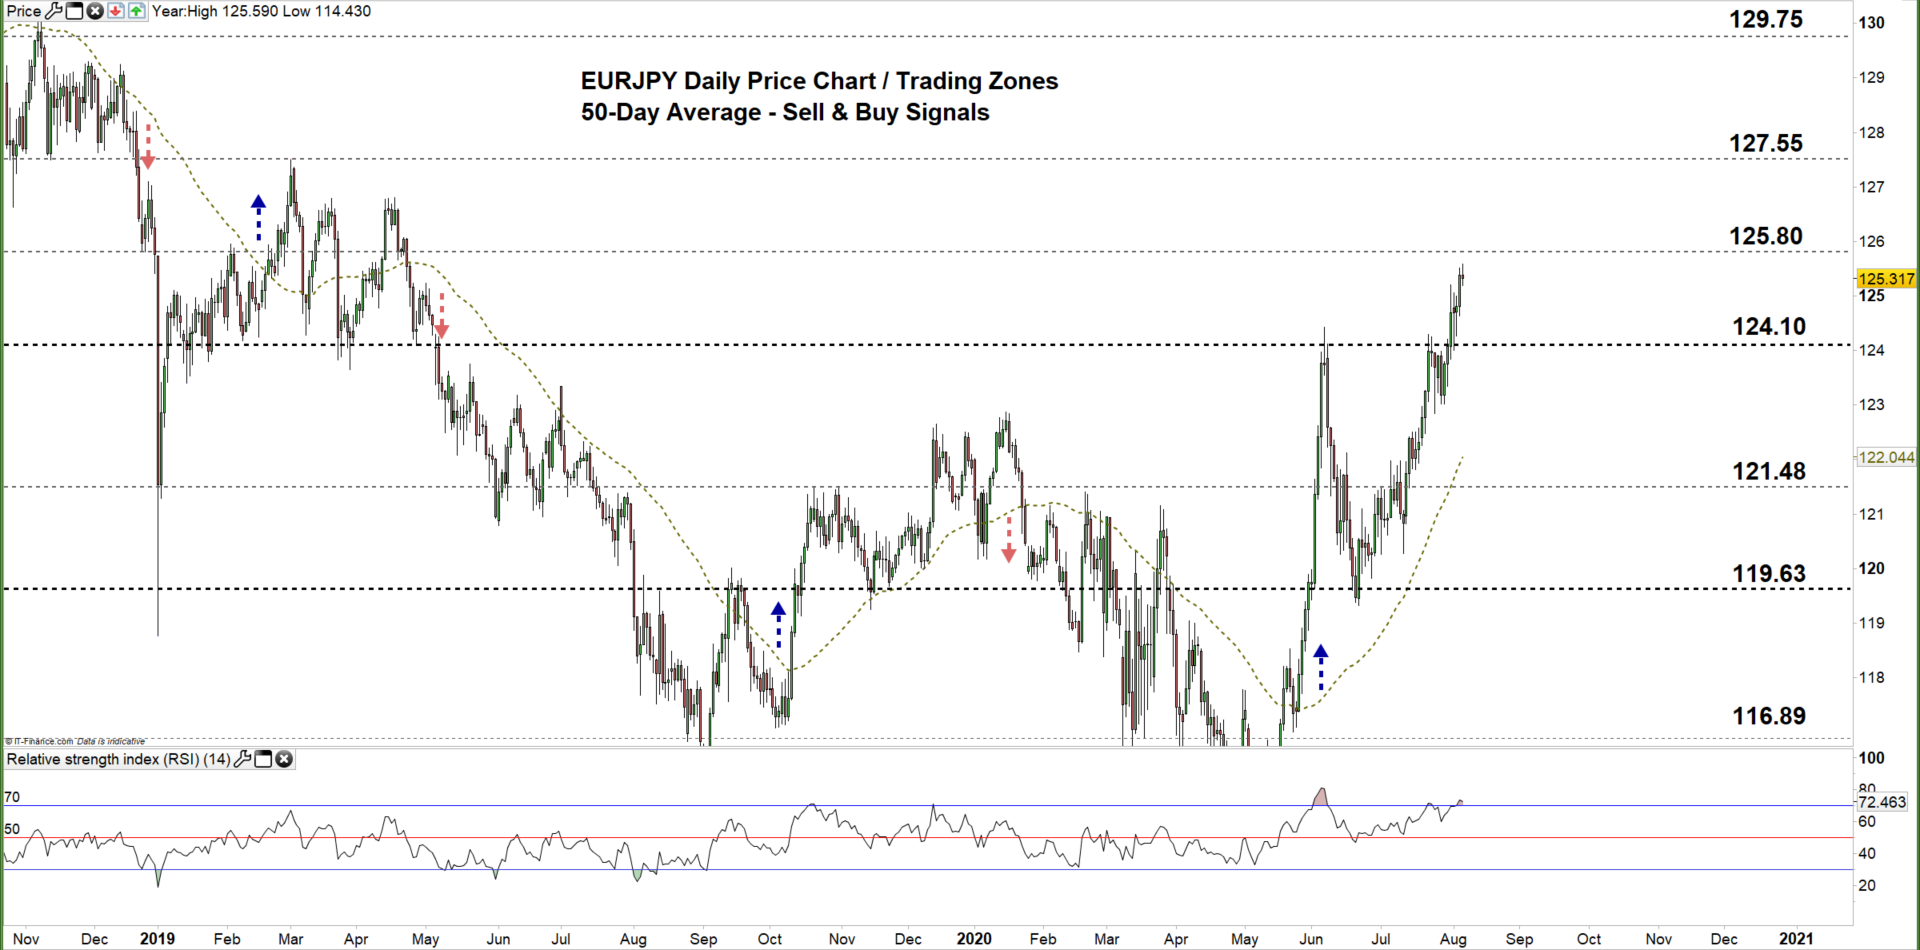
EUR/JPY Daily PRice CHART (Nov 1, 2018 – August 6, 2020) Zoomed Out

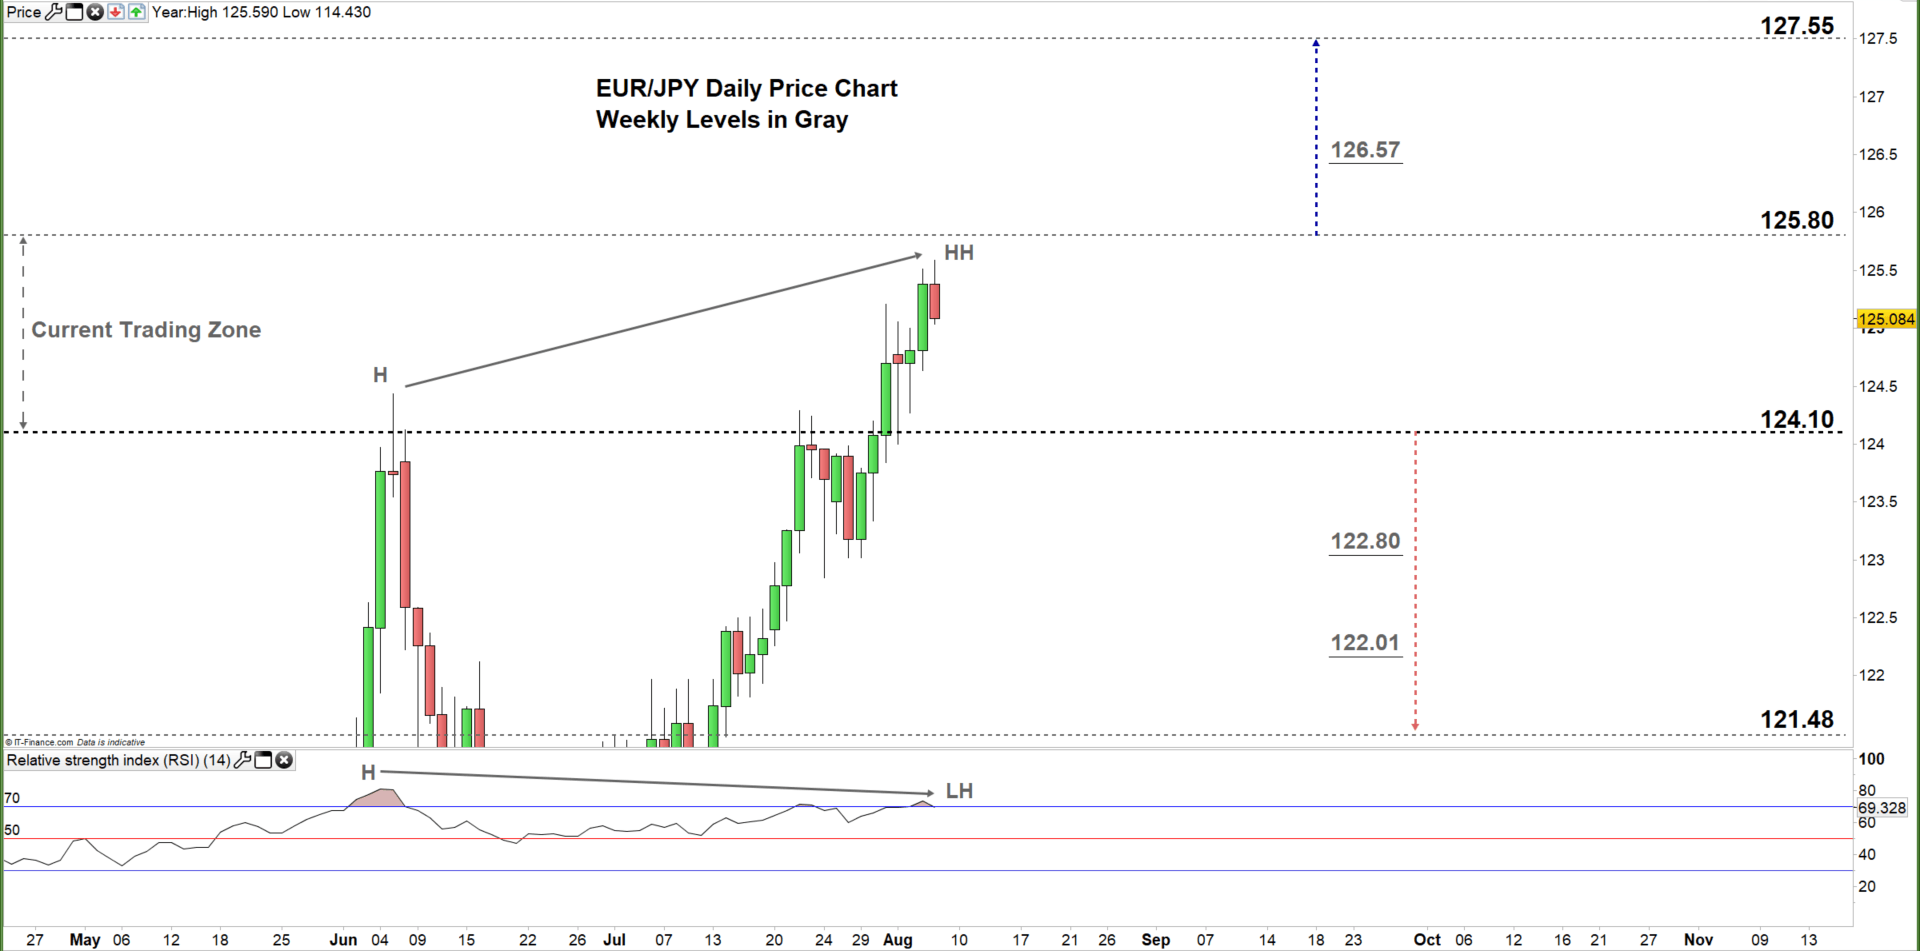
EUR/JPY Daily Price CHART (April 26 – August 6, 2020) Zoomed in
On July 31, EUR/JPY climbed to the current 124.10 -125.80 trading zone highlighting the strength of the bullish momentum. Today, the price rallied to an over 15-months high at 125.59.
However, it’s important to note the price and RSI divergence as the former created a higher high, while the latter created a lower high, signaling a possible reversal of the upward trend.
A close above the high end of the zone could encourage bulls to extend the rally towards the monthly resistance level at 127.55 ( November 2018 low).
On the other hand, a failure in closing above the high end of the zone could reverse the pair’s direction towards the low end of the zone ( December 2016 high).

EUR/JPY Four Hour Price CHART (July 13 – AUgust 6, 2020)
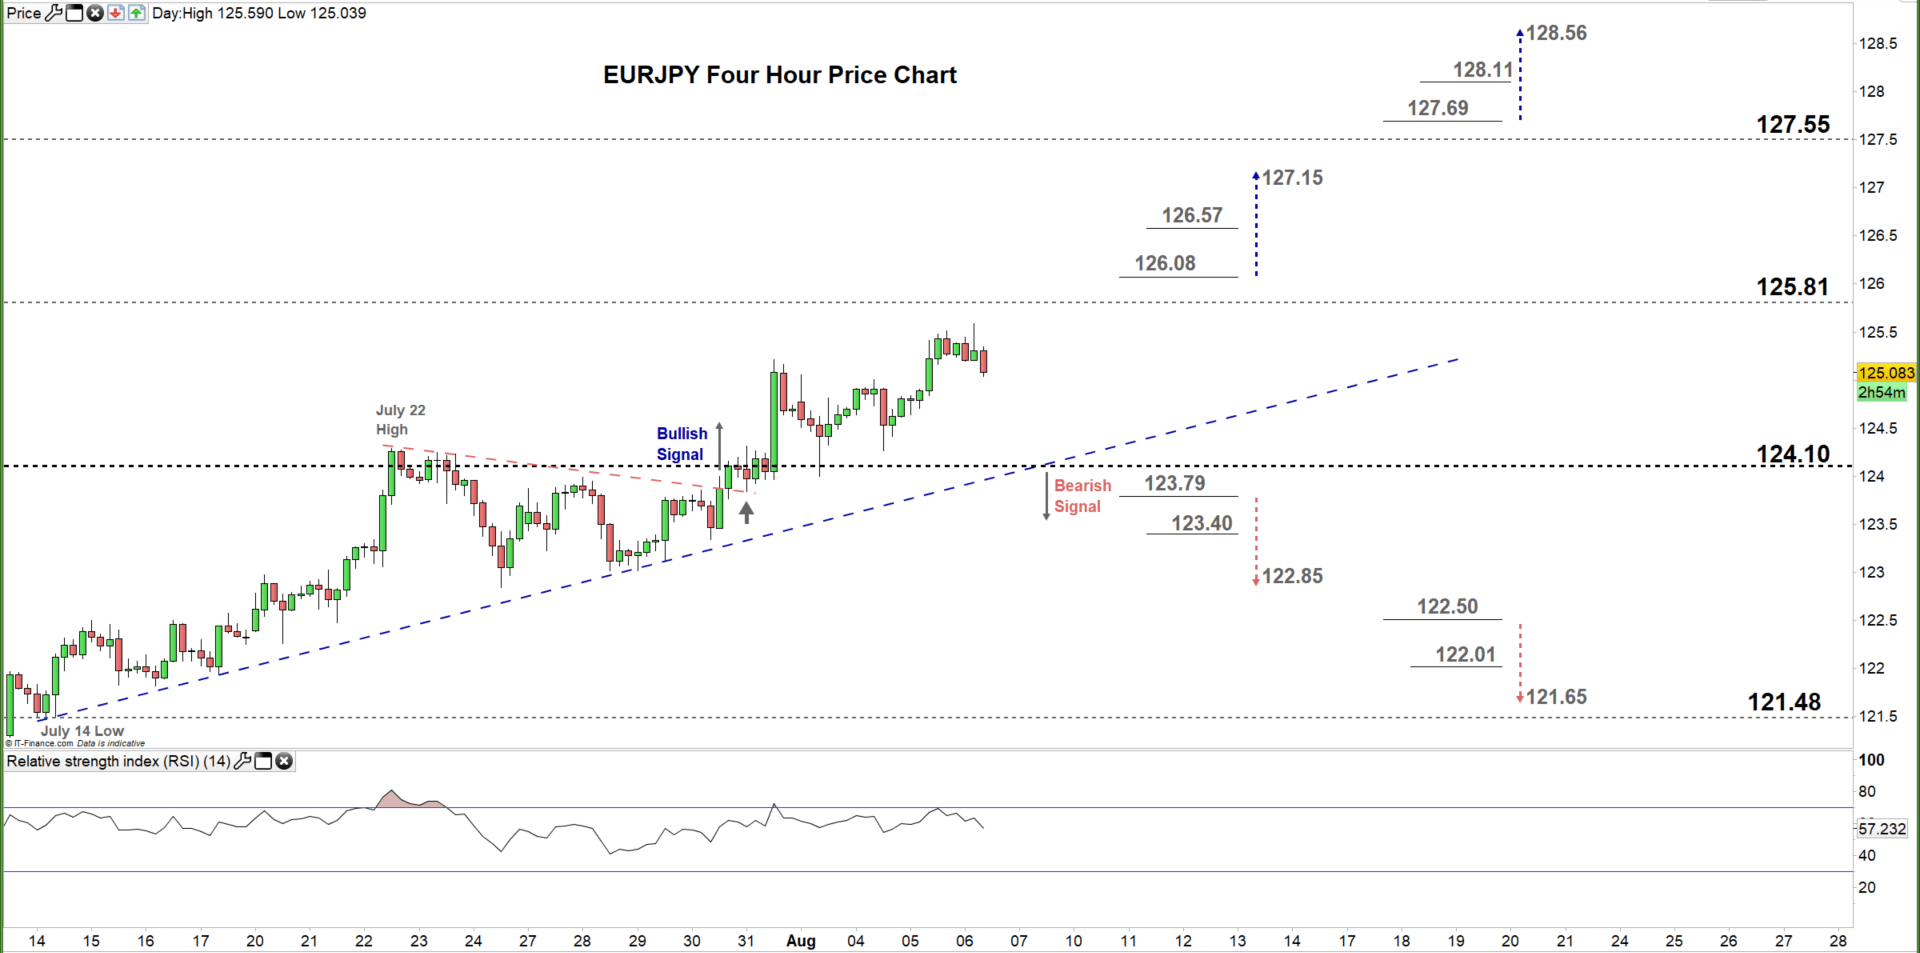
On July 30, EUR/JPY traded above the downward sloping trendline resistance originated from the July 22 high at 124.29 indicating a shift in favor of the bull’s to control.
To conclude, while the bulls have the upper hand a price/RSI divergence provides a good base of a possible reversal. Additionally, a violation of the bullish trendline support originated from the July 14 low at 121.47 would reflect a weaker bullish bias.
Therefore, a break below 123.79 could send EURJPY towards 122.85, while a break above 126.08 may trigger a rally towards the 127.15. As such, the daily support and resistance levels marked on the four-hour chart should be monitored.
Written By: Mahmoud Alkudsi, Market Analyst
Please feel free to contact me on Twitter: @Malkudsi


