


EUR vs JPY Technical Outlook
EUR/JPY Price- Indecisive traders
On Friday, EUR/JPY declined to a near two-week low at 120.27 however, the price rallied after and closed the weekly candlestick with a Doji pattern and reflected the market indecision at that point. The Relative Strength Index (RSI) remained above 50 and highlighted that bulls still have the upper hand.
Last week, the Japanese yen recovered some ground against major currencies as investors moved away from riskier assets and favored safe havens on fears from the surging of Coronavirus infections.
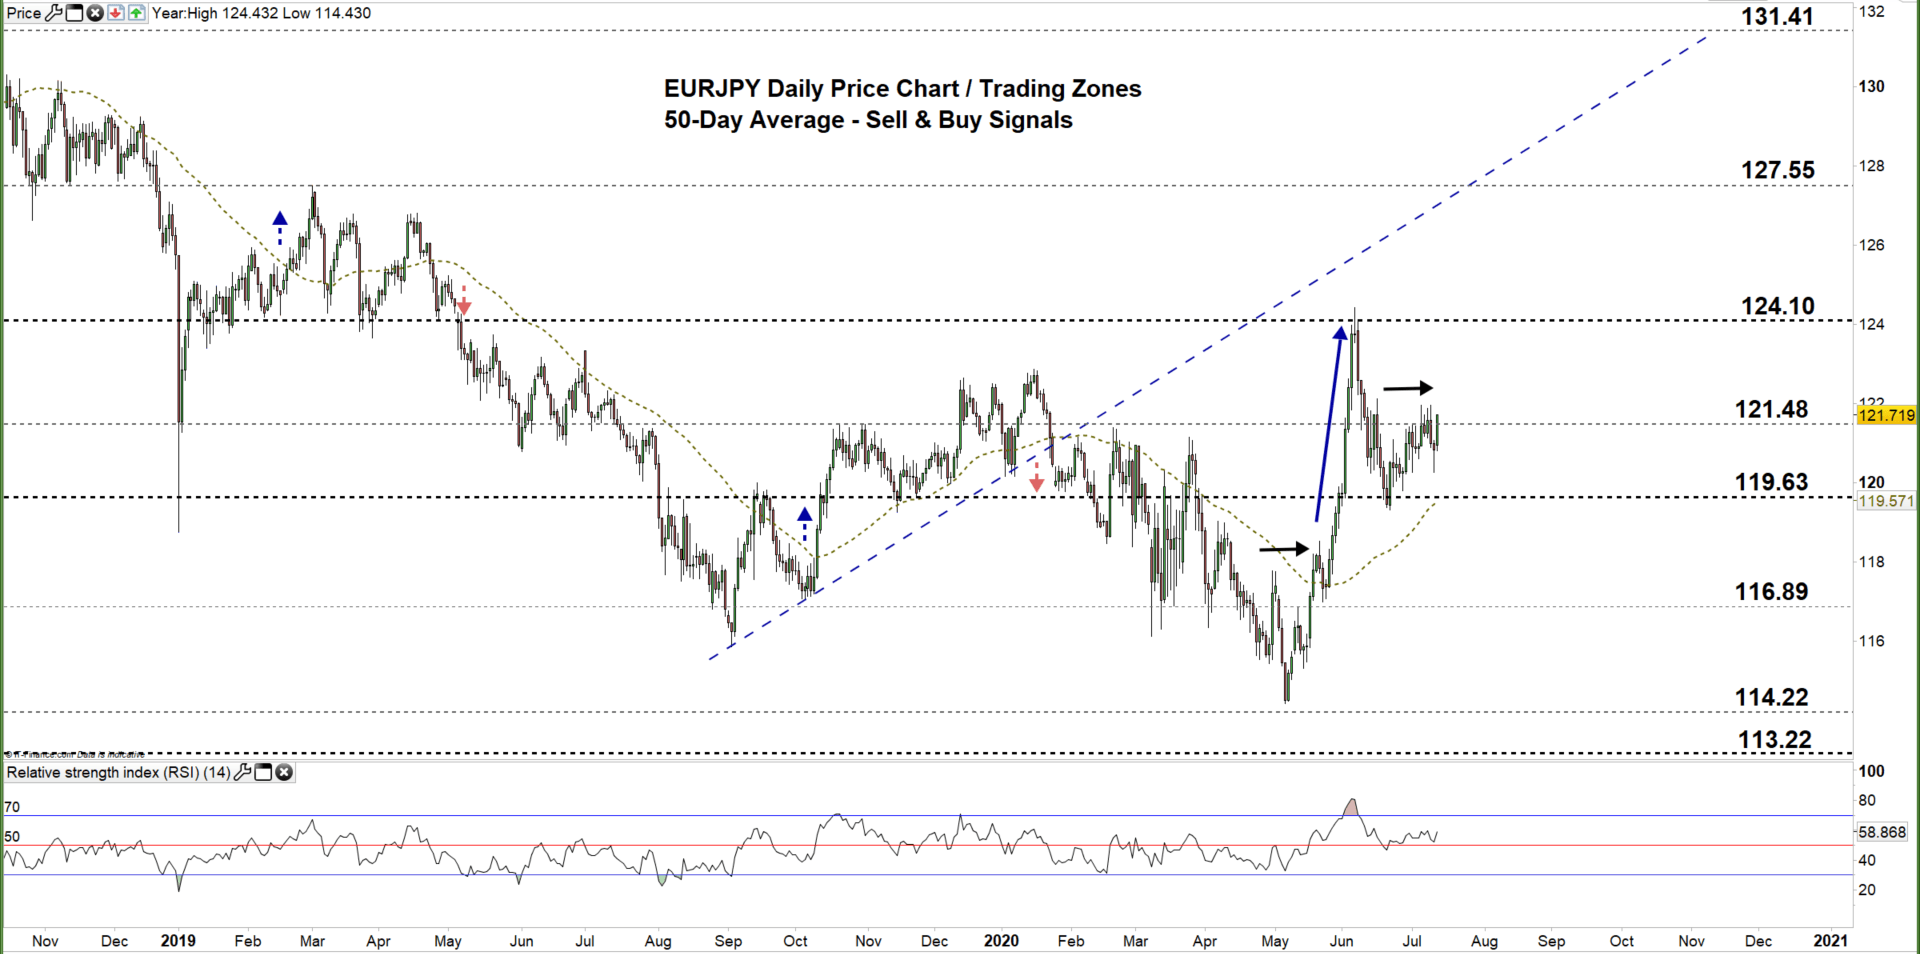
EUR/JPY Daily PRice CHART (Sep 1, 2018 – JuLY 13, 2020) Zoomed Out

EUR/JPY Daily Price CHART (March 2 – JuLY 13, 2020) Zoomed in
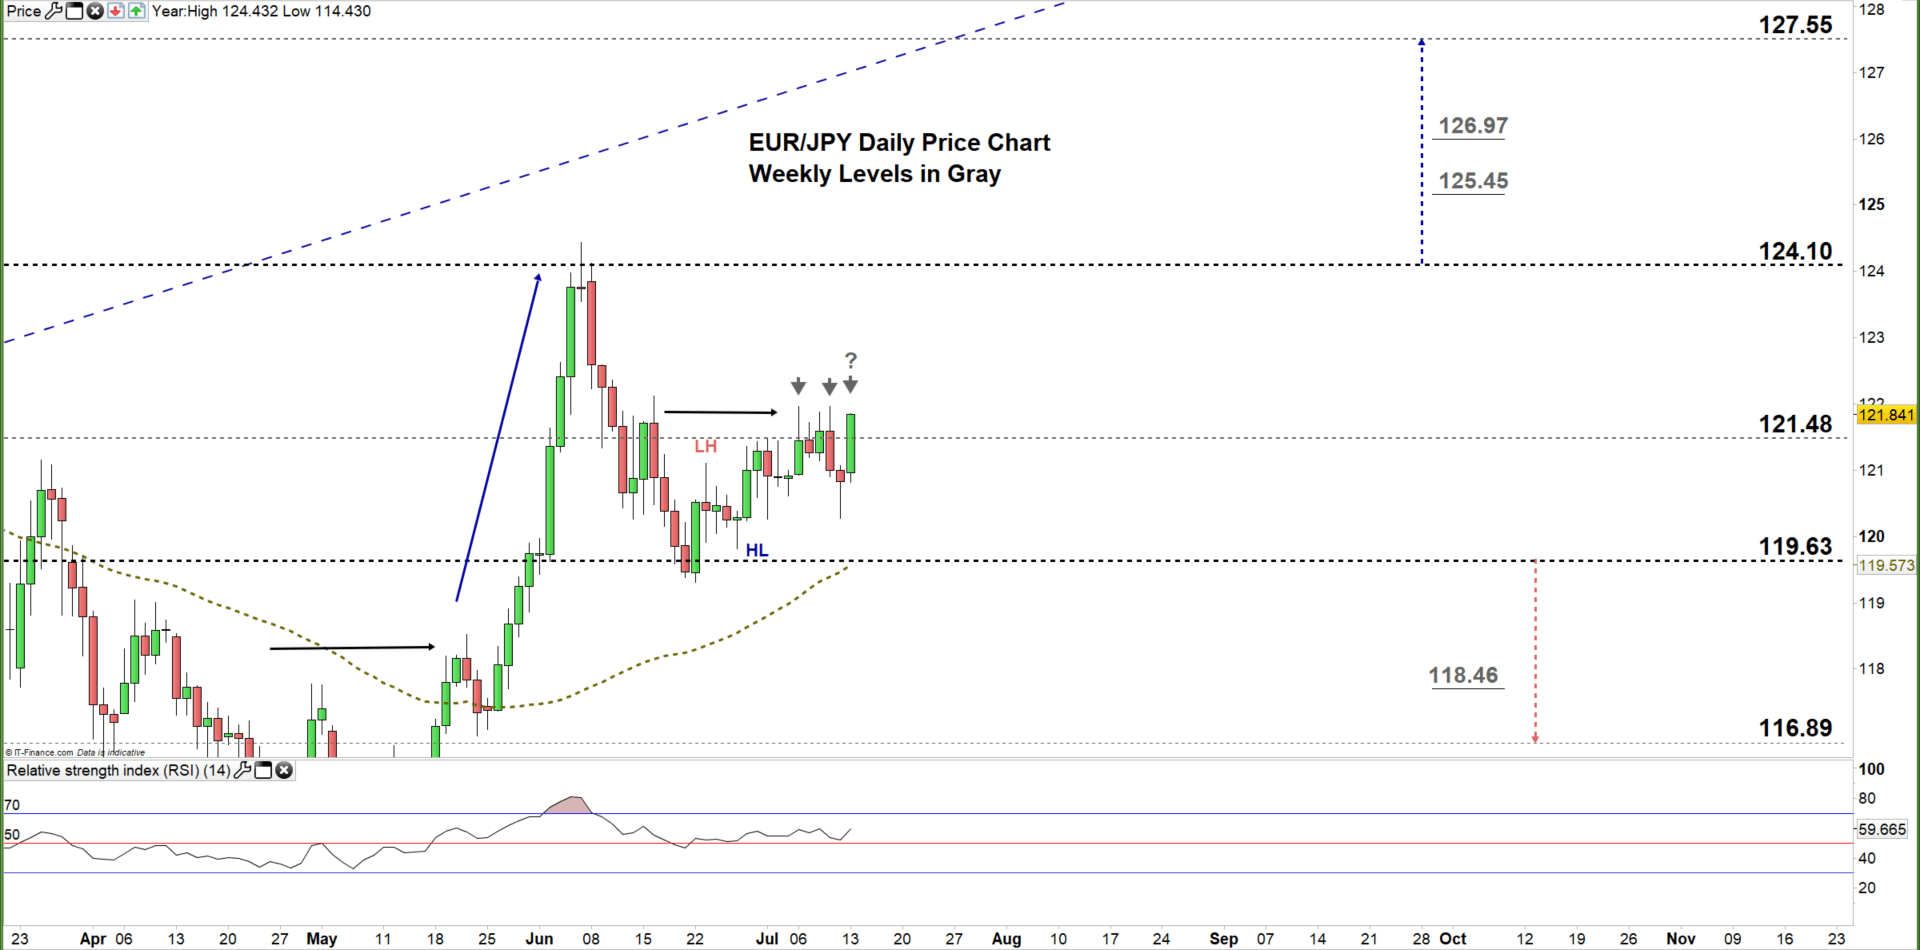
On June 26, EUR/JPY corrected its downside trend and traded in a sideways. Last week, the market failed twice to break above 121.96 and declined to the current trading zone 119.63- 121.48. Today, the market attempts to climb to the higher trading zone.
A successful close above the high end of the current trading zone signals that bulls could push EURJPY towards 124.10. A further close above that level may encourage them to extend the rally towards 127.55.
On the other hand, any failure in closing above the high end of the zone indicates that the pair could fall towards the low end of the zone. A further close below that level may embolden bears to press the market towards 116.89.

EUR/JPY Four Hour Price CHART (May 22– JuLY 13, 2020)

On Thursday, EUR/JPY broke below the first uptrend line originated from the June 26 low at 119.81, and generated a bearish signal. Nonetheless, the market has reversed higher and tests the downtrend line originated from the June 9 high at 122.51 therefore, any successful break above this line would generate a bullish signal, while any break below the second uptrend line originated from the June 26 low would generate a bearish signal.
To conclude, a break above 122.48 may trigger a rally towards the 123.40, while a break below 120.63 could send EURJPY towards 119.94. Yet, the daily support and resistance levels marked on the four-hour chart should be watched closely.
Written By: Mahmoud Alkudsi, Market Analyst
Please feel free to contact me on Twitter: @Malkudsi


