


EUR vs JPY Technical Outlook
- Weaker risk-on sentiment slows down the Japanese yen selloff
- EUR vs JPY price chart reveals bearish signals
EUR/JPY Price- Bulls Pullback
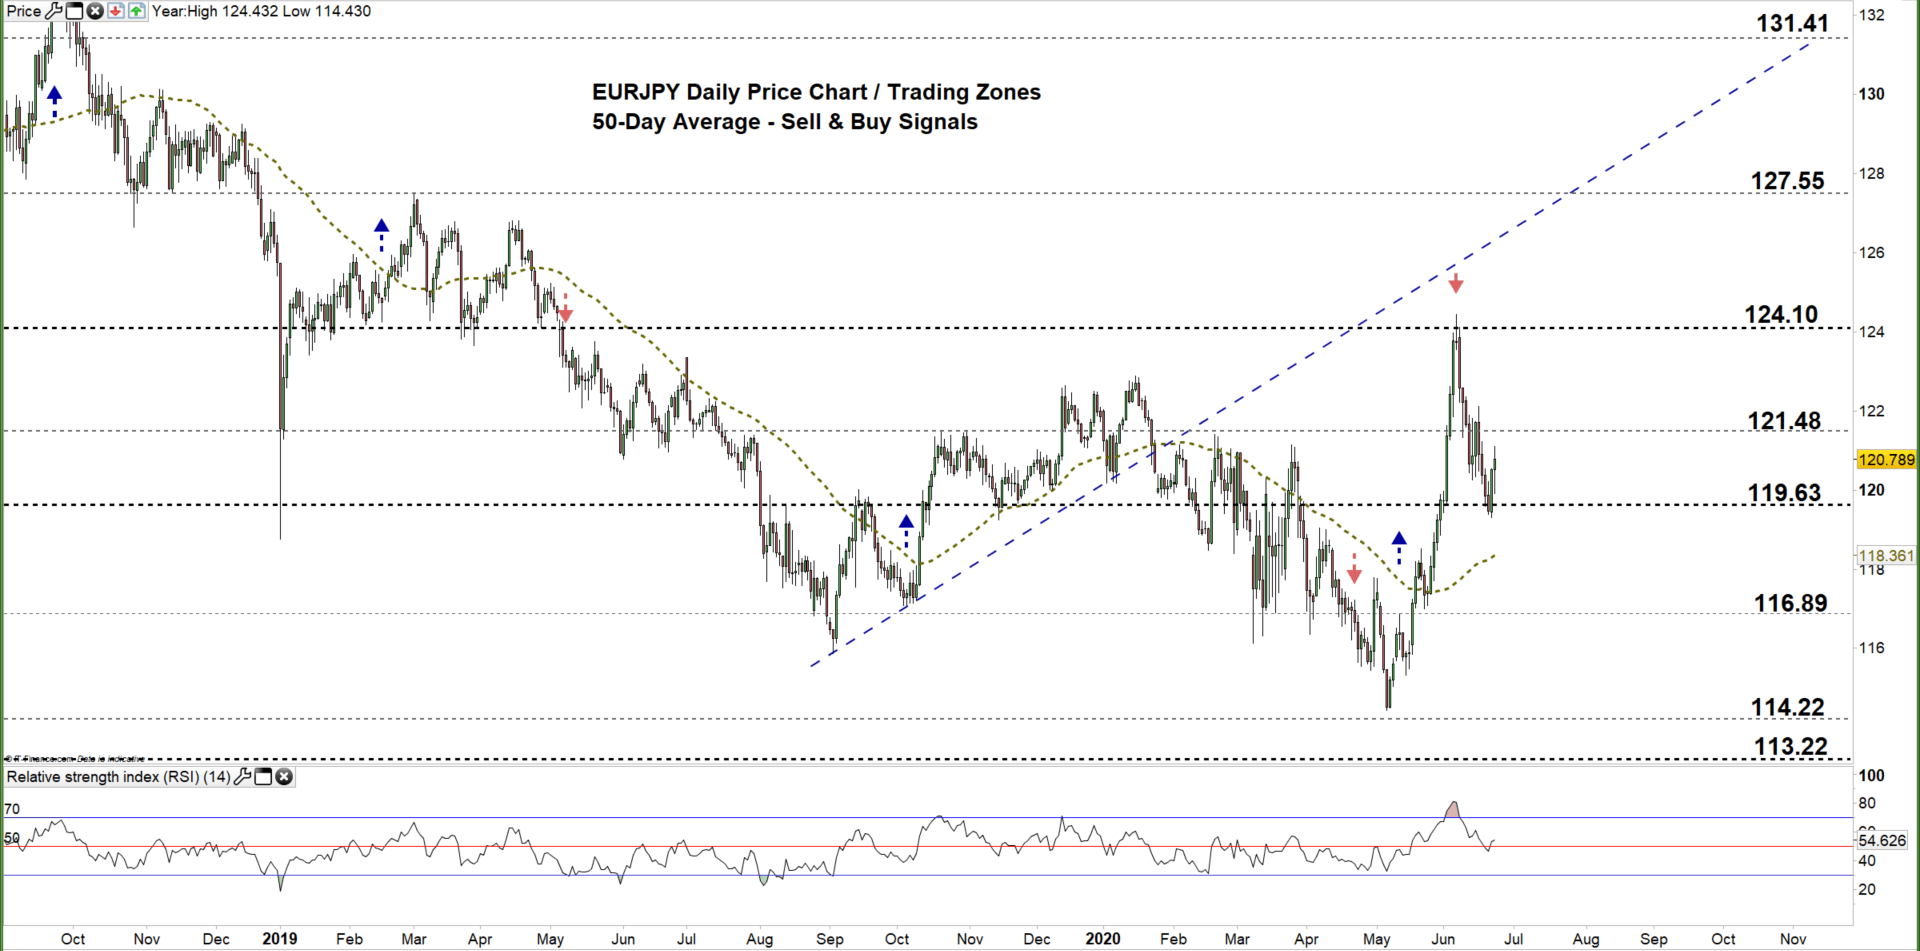
On June 5, EUR/JPY took off to an over thirteen-month low at 124.43. However, the price retreated as some bulls seemed to cut back. Last week, bulls eased further and this led the market to close the weekly candlestick in the red with a 1.1% loss.
The Japanese yen retreated recently due to the risk-on sentiment driven by the central bank's stimulus around the globe combined with the gradual easing of restrictions. Yet, the prospect of a second wave of coronavirus kept investors jittery.
EUR/JPY Daily PRice CHART (JULY 1, 2018 – June 23, 2020) Zoomed Out

EUR/JPY Daily Price CHART (March 2 – June 23, 2020) Zoomed in
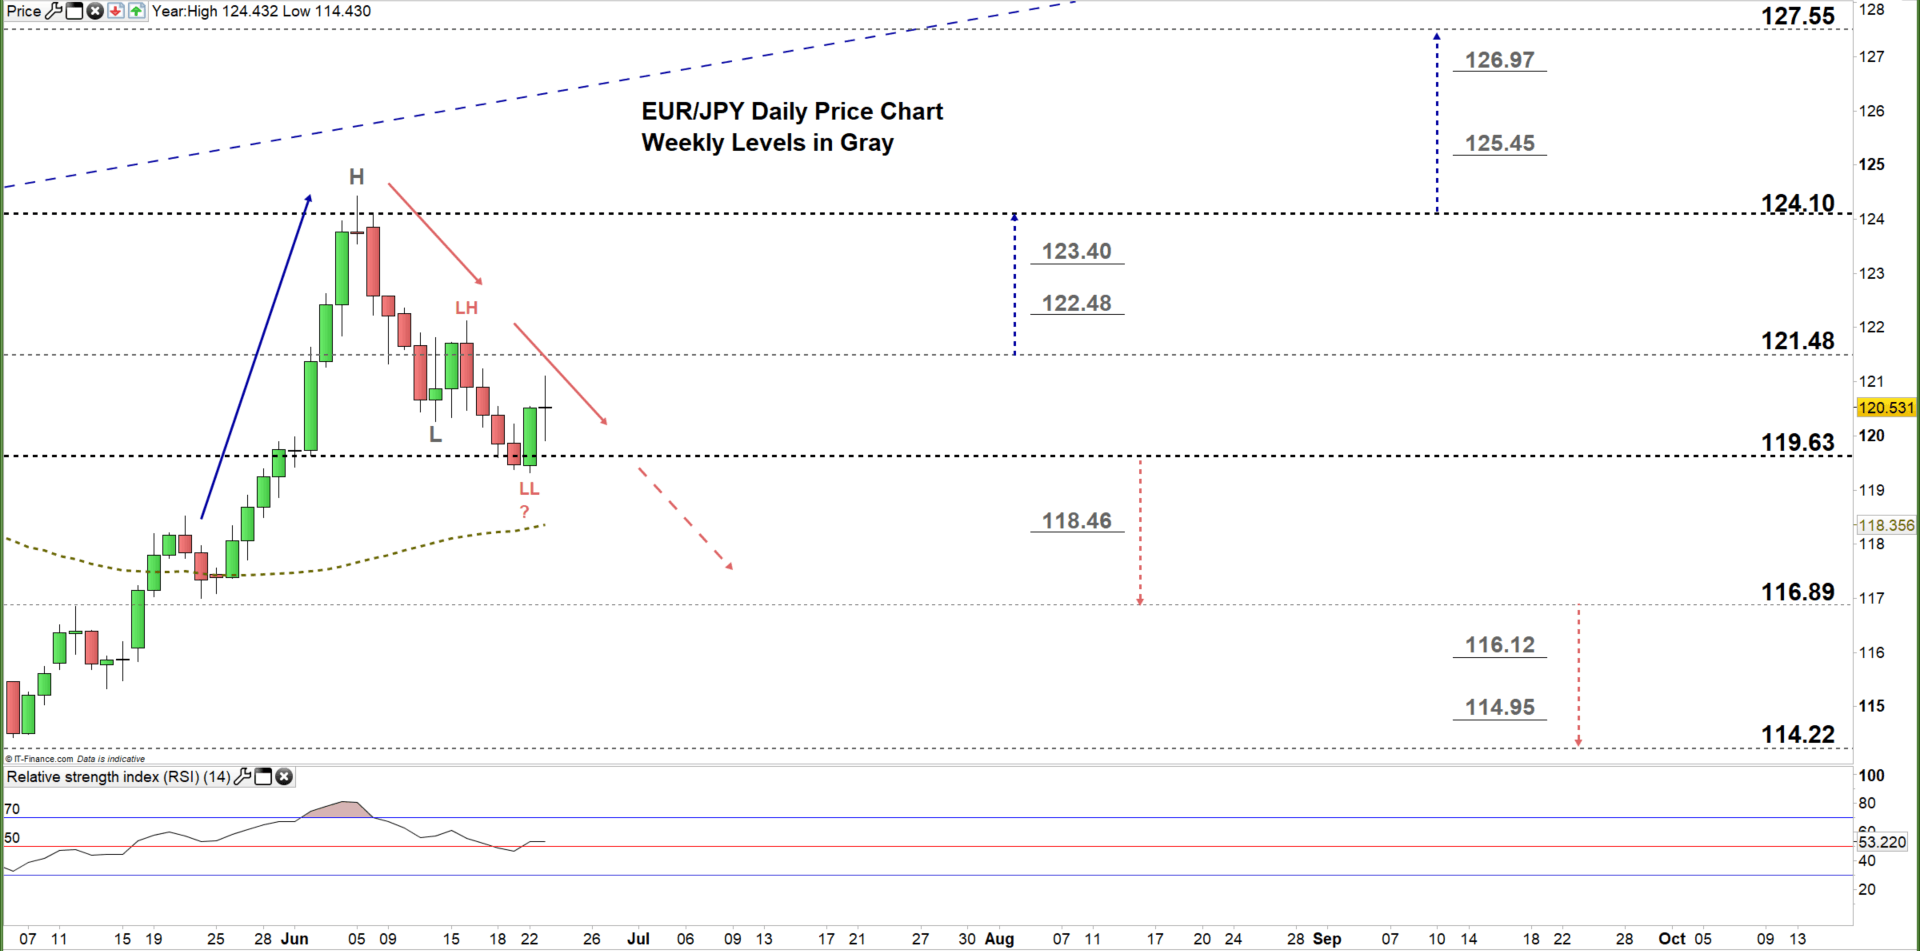
On June 16, EUR/JPY corrected its upward trend and created a lower high at 122.11 indicating that bulls were losing momentum. Yesterday, the price declined to an over three-week low at 119.31. However, the market rallied to the current trading zone 119.63 – 121.48 reflecting bear’s hesitation at this stage.
Thus, a close above the high end of the aforementioned trading zone signals that bulls may push towards 124.10. Any further close above that level could extend the rally towards 127.55.
On the other hand, a close below the low end of the zone may start a downward trend towards116.89. Any further close below that level could encourage bears to press EURJPY towards 114.22.

EUR/JPY Four Hour Price CHART (May 22– June 23, 2020)

On Wednesday, EUR/JPY broke below the uptrend line originated from the June 1 low at 119.42, and generated a bearish signal. Today, the price tests this line, and any failure to break above it signals bull’s weakness.
Therefore, a break below the uptrend line originated from the May 22 low at 116.99 would produce another bearish signal. In turn, any break above the downtrend line originated from the June 9 high at 122.51 would generate a bullish signal.
To conclude, a break below 119.03 could send EURJPY towards 117.76 on the other hand, any break above 121.65 may trigger a rally towards the 122.48. Nonetheless, the daily support and resistance marked on the four-hour chart should be kept in focus.
Written By: Mahmoud Alkudsi, Market Analyst
Please feel free to contact me on Twitter: @Malkudsi


