


Euro vs Japanese Yen Technical Outlook
- EUR/JPY soars to a multi-week high
- Key chart points and signals to monitor
Accelerated Bullish Momentum
On Friday, EUR/JPY took off to 119.89 – Its highest level in nine weeks. The price retreated after as some bulls seemed to cut back yet, the weekly candlestick closed in the green with a 2.0% gain.
Alongside that, the Relative Strength Index (RSI) rose from 55 to 68 highlighting the strength of the bullish momentum.
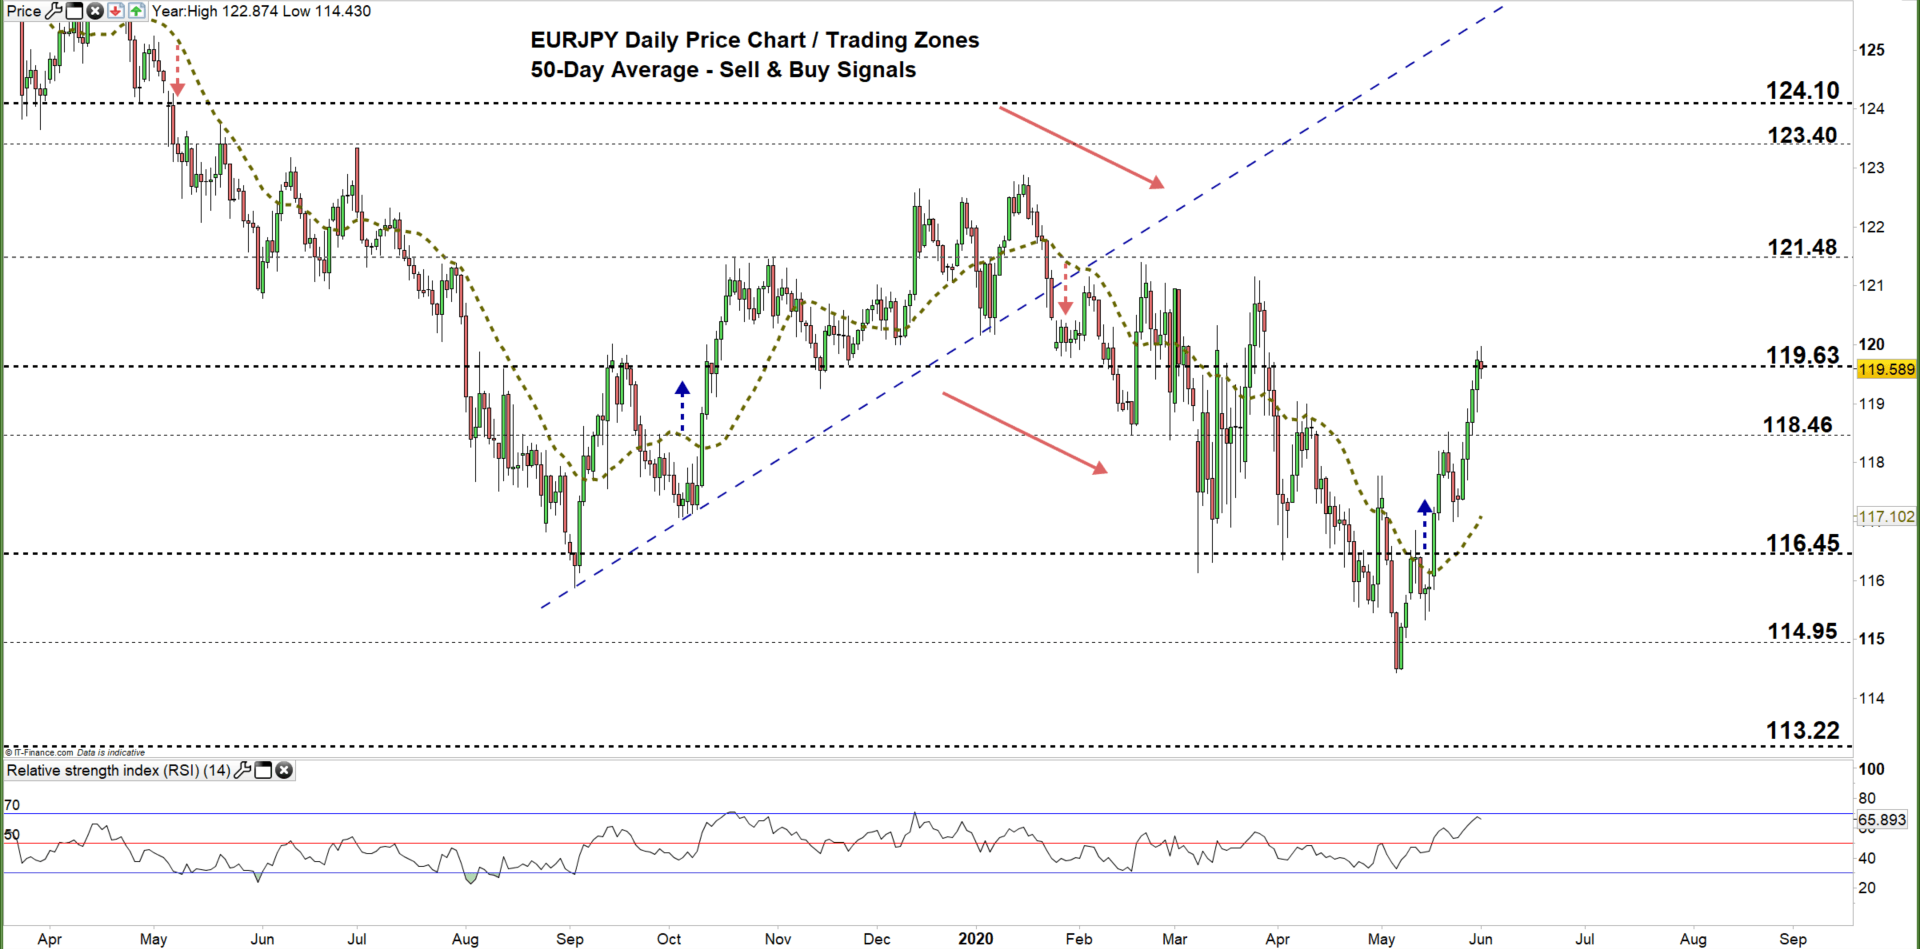
EUR/JPY Daily PRice CHART (JULY 1, 2018 – June 1, 2020) Zoomed Out

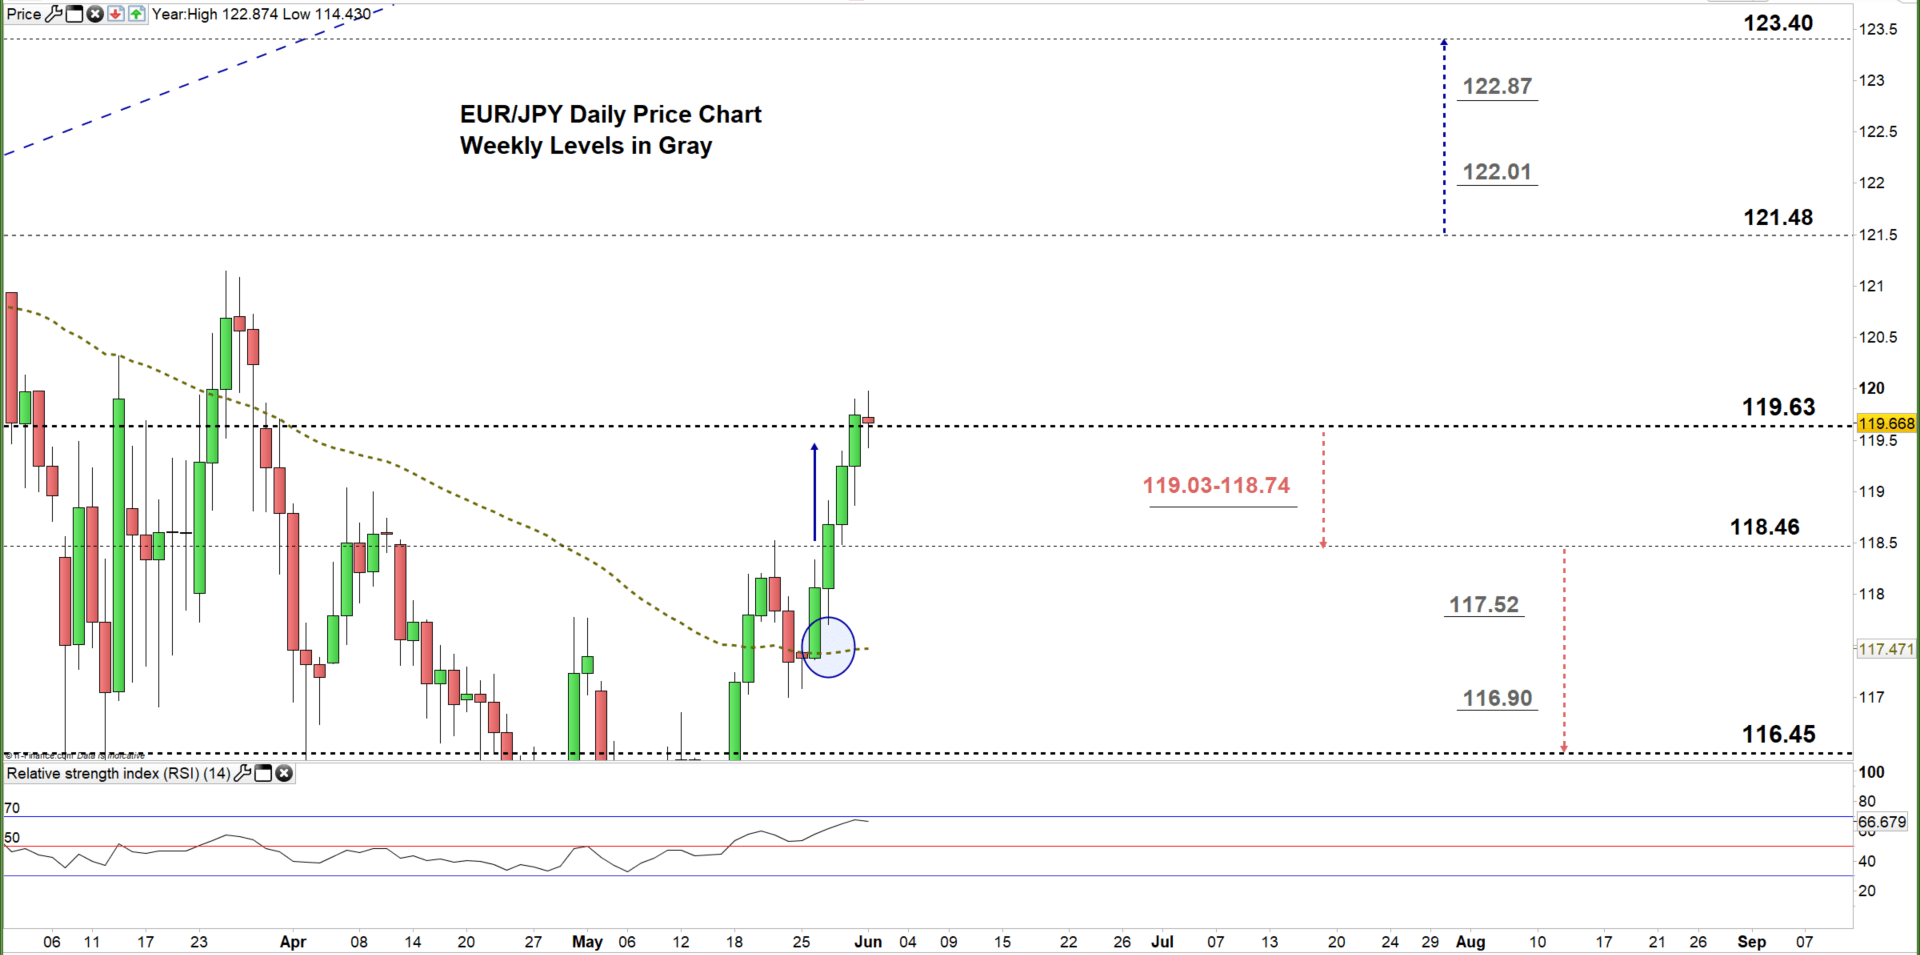
EUR/JPY Daily Price CHART (March 2 – June 1, 2020) Zoomed in
On Tuesday, EUR/JPY rallied and closed above the 50-day moving average indicating that bulls were retaking momentum. By the end of the week, the price climbed to the current trading zone 119.63 – 121.48 and generated a bullish signal.
Another close above the low end of the aforementioned trading zone signals that bulls may push towards the high end of it. A further close above that level could extend the rally towards 123.40.
On the flip side, a close below the low end of the zone highlights bull’s hesitation. Although, it would require more than one close to conclude a weakening bullish momentum. In that scenario, EURJPY may fall towards 118.46.
That said, the daily and weekly support/ resistance levels underlined on the daily chart (zoomed in) should be considered in both bullish/ bearish scenarios.

EUR/JPY Four Hour Price CHART (April 7 – June 1, 2020)
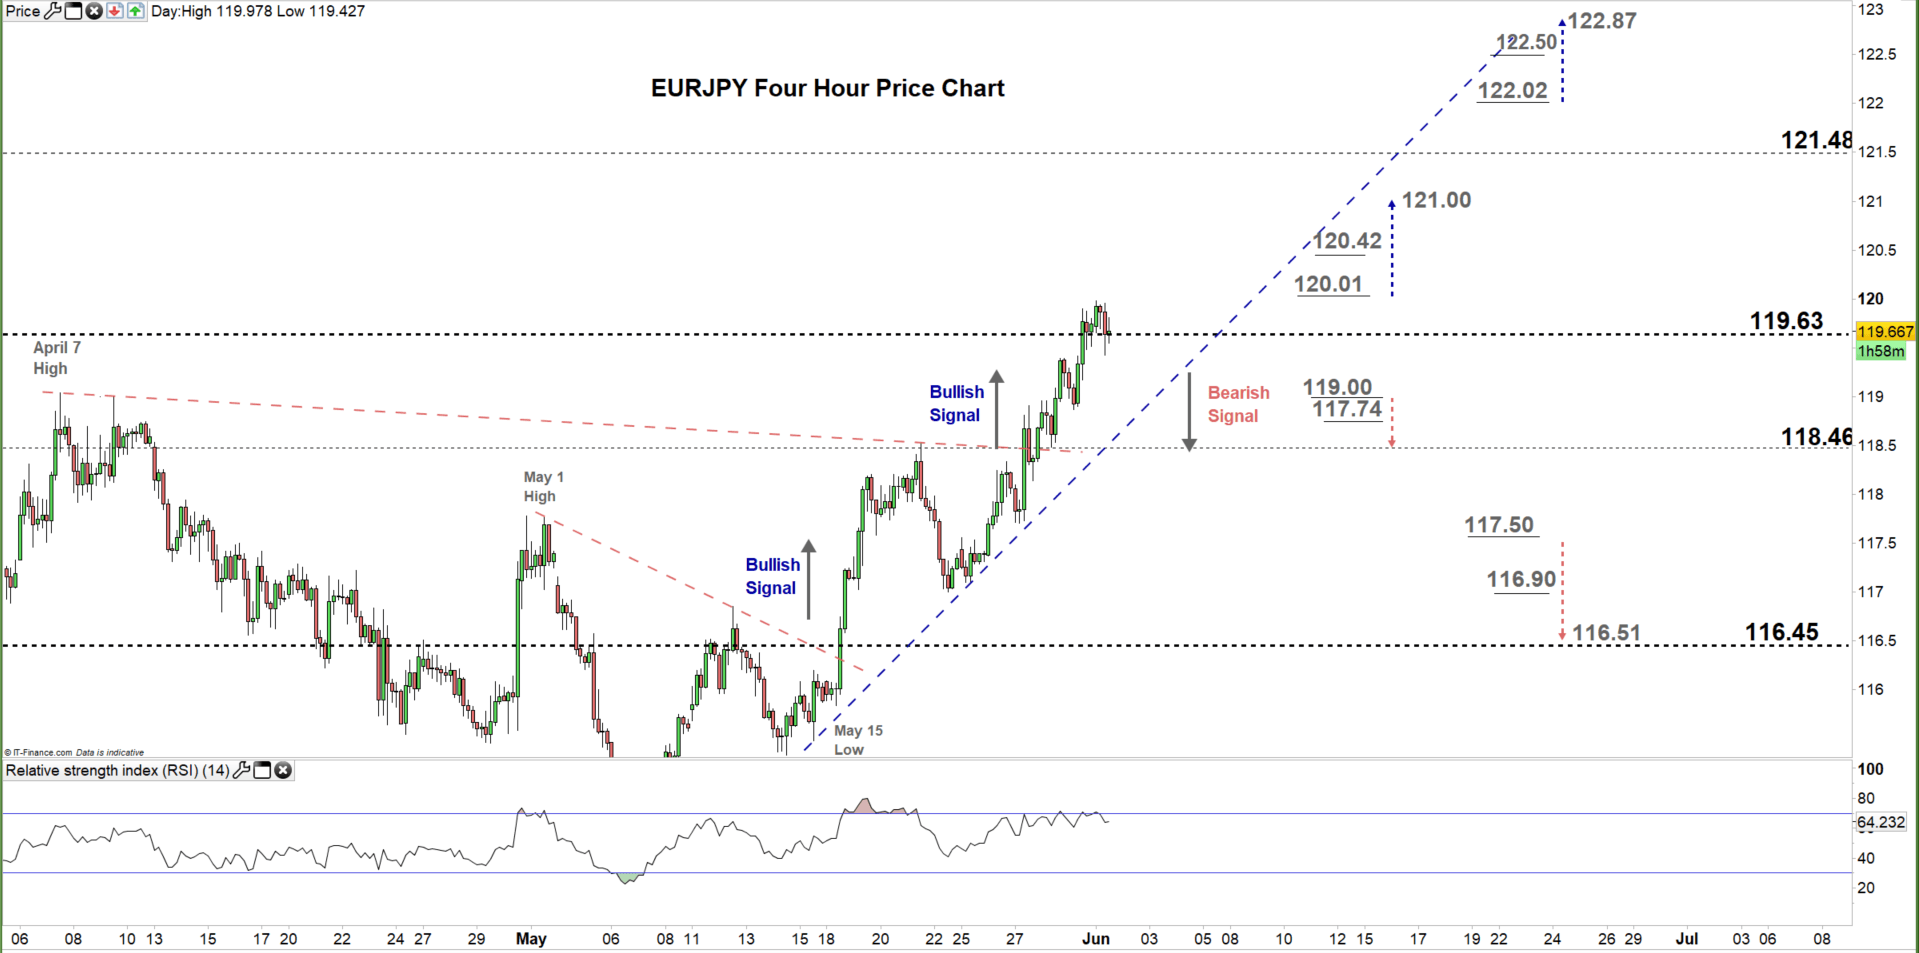
On Wednesday, EUR/JPY rallied above the downtrend line originated from the April 7 high at 119.03 and resumed its uptrend creating a set of higher highs with higher lows. Currently, the pair trades above the uptrend line originated from the May 15 low at 115.47 yet, any violation of this line may correct the bullish move.
Thus, a break below 119.00 signals a possible fall towards 118.46. In turn, any break in the other direction i.e. above 120.01 may trigger a rally towards the 121.00 handle. Nonetheless, the daily and weekly support and resistance marked on the four-hour chart should be kept in focus.
Written By: Mahmoud Alkudsi, Market Analyst
Please feel free to contact me on Twitter: @Malkudsi


