Euro vs Japanese Yen Technical Outlook
Bulls Ease up
On Thursday, EUR/JPY rallied to an over six-week high at 118.52 . The price retreated and settled below the 118.00 handle. Nevertheless, the weekly candlestick closed on Friday in the green with a 1.2% gain.
Alongside that, the Relative Strength Index (RSI) fell from 61 to 51 highlighting a slower bullish momentum.
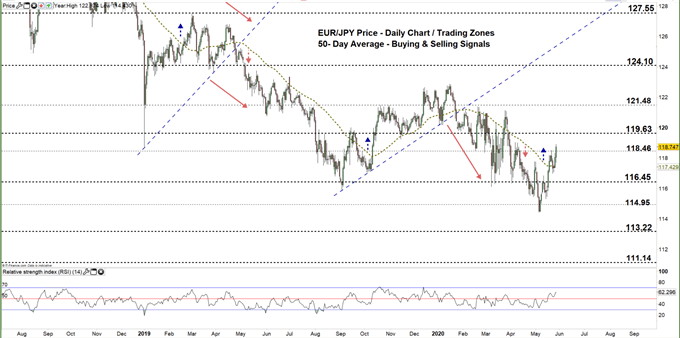
EUR/JPY Daily PRICE CHART (JULY 1, 2018 – May 27, 2020) Zoomed Out


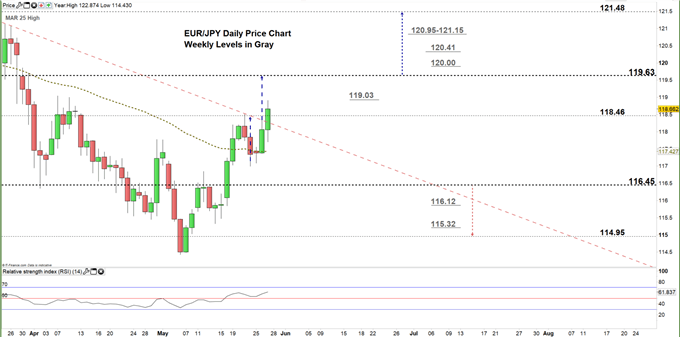
EUR/JPY Daily Price CHART (March 6 – May 27, 2020) Zoomed in

Looking at the daily chart, yesterday EUR/JPY reversed higher and closed above the 50-day moving average and generated a bullish signal. Today, the price has broken above the downtrend line originated from the March 25 high at 121.15 then climbed to a higher trading zone 118.46 – 119.63.
A close above the low end of the aforementioned zone signals that bulls may push towards the high end of the zone. A further close above that level opens could extend this rally towards 121.48. Yet, the weekly resistance area and levels marked on the chart (zoomed in) should be monitored.
In turn, a close below the low end of the zone reflects a bull’s hesitation. That said, it would require more than one failure to conclude a weakening bullish sentiment and in that scenario, the pair may fall towards 116.45. A further close below that level could send EURJPY even lower towards 114.95. Nonetheless, the weekly support levels underlined on the chart should be watched closely.


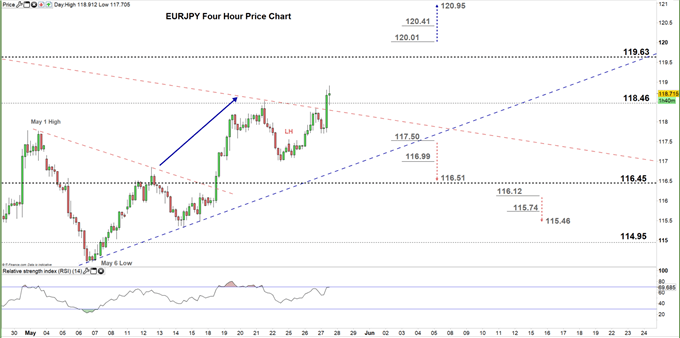
EUR/JPY Four Hour Price CHART (May 1 – May 27, 2020)

Based on the analysis of the four-hour chart, last week EUR/JPY rallied above the downtrend line originated from the May 1 high at 117.76 then started a bullish momentum creating a set of higher highs with higher lows. This week, the price corrected its uptrend and carved out a lower high at 117.55.
A break below 117.50 would be considered a bearish signal and could send EURJPY towards 116.51. Although, the daily support level underscored on the chart should be considered. On the other hand, a break above 120.01 may trigger a rally towards 120.95. Yet, the weekly resistance level printed on the chart should be kept in focus.
Written By: Mahmoud Alkudsi, Market Analyst
Please feel free to contact me on Twitter: @Malkudsi


