


Euro vs Japanese Yen Technical Analysis
- The pair broke below a major support to a multi-year low
- Key levels and trading zones to keep track of
Bears in Control
On Friday, EUR/JPY tumbled to over three year low at 115.54 then rallied after as some bears seemed to cover. Yet, the weekly candlestick closed in the red with a 0.5% loss.
Alongside that, the Relative Strength Index (RSI) fell from 40 to 33 reflecting the bearish outlook of the market.
EUR/JPY Daily PRice CHART (JULY 1, 2018 – April 28, 2020) Zoomed Out


EUR/JPY Daily Price CHART (Jan 9 – April 28, 2020) Zoomed in
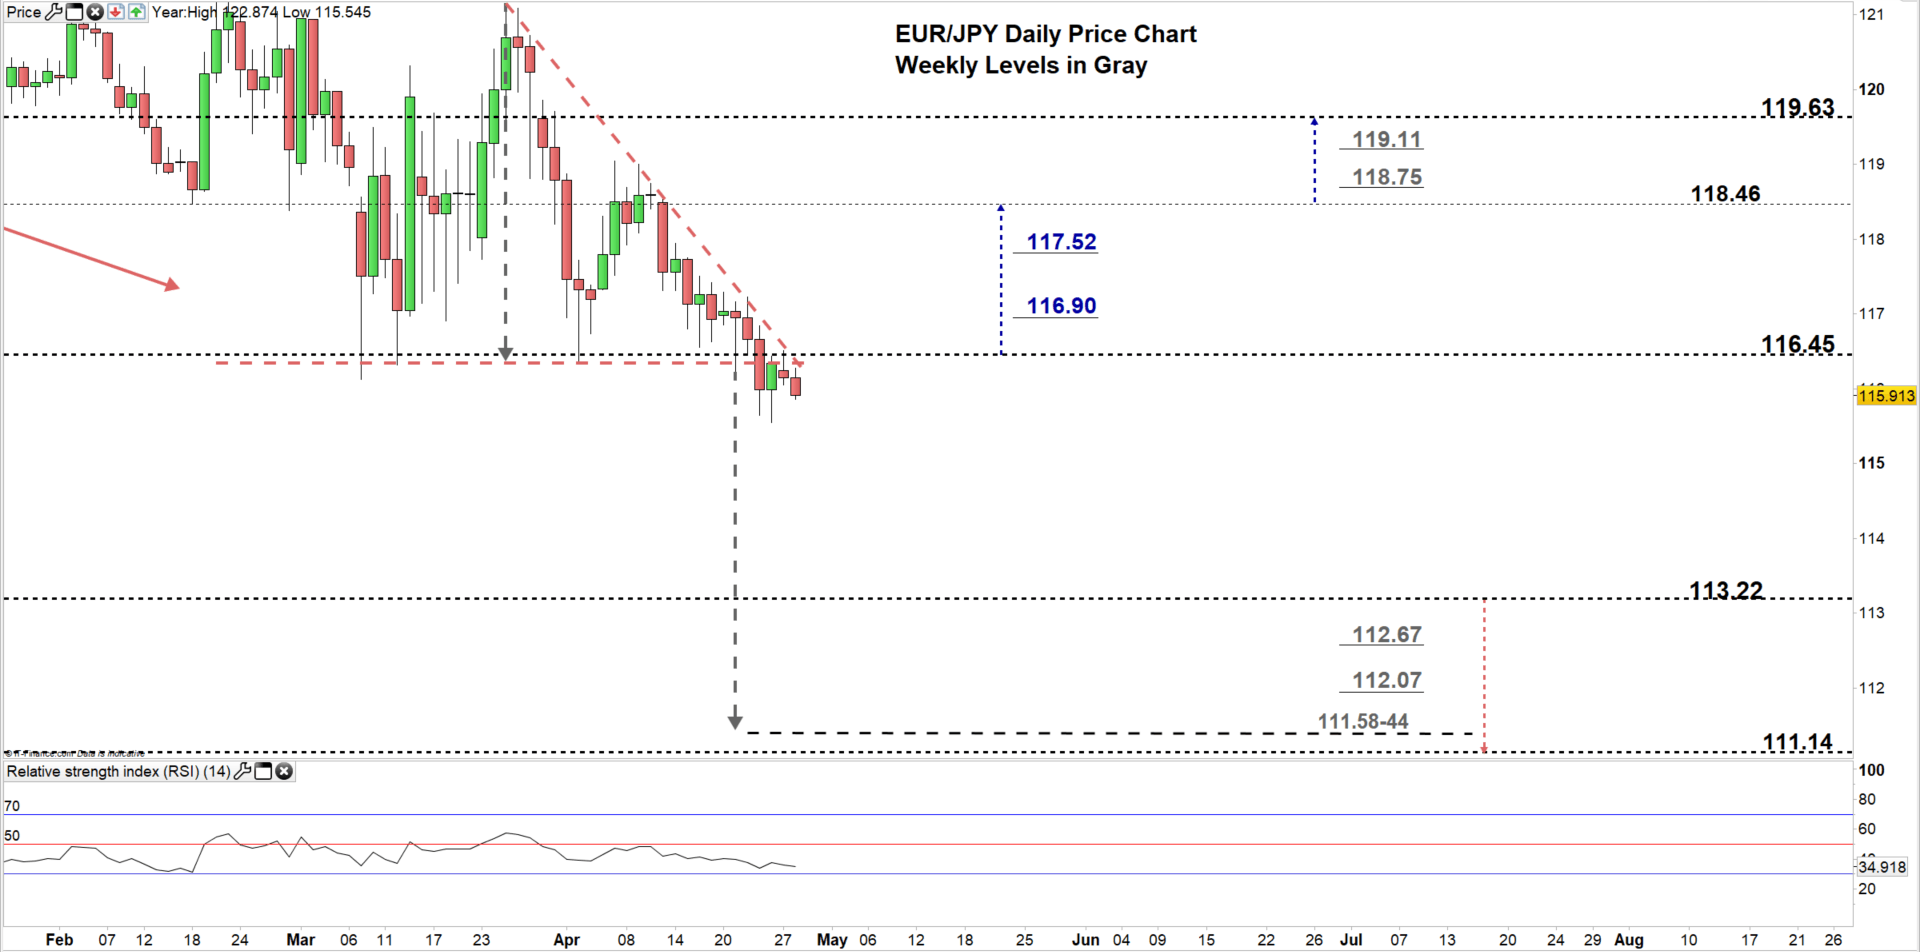
Looking at the daily chart, I notice that on Thursday EUR/JPY declined to the current trading zone 113.22- 116.45 reflecting a stronger bearish sentiment. Additionally, the price broke and remained below the lower line of the descending triangle pattern generating another bearish signal.
Hence, bears might press towards the low end of the aforementioned zone. A further close below that level might encourage them to lead EURJPY even lower towards 11.14. That said, the weekly support levels underlined on the chart should be monitored.
On the other hand, any close above the high end of the zone negates the triangle pattern and reflects bears hesitation at this point. This may cause a rally towards 118.46. A further close below that level could extend the rally towards 119.63. Yet, the daily and weekly resistance levels marked on the chart should be kept in focus.

EUR/JPY Four Hour Price CHART (Jan 9 – April 28, 2020)

From the four hour chart, I noticed that on April 10 EUR/JPY broke below the uptrend line originated from the April 3 low at 116.73 then started a downtrend creating lower highs with lower lows.
A break below 115.49 could resume bearish price action towards 114.94. Although, the weekly support level marked on the chart should be monitored. In turn, any break in the other direction i.e. above 117.07 could send EURJPY towards 118.20. Nevertheless, the daily resistance level printed on the chart should be watched closely.

Written By: Mahmoud Alkudsi, Market Analyst
Please feel free to contact me on Twitter: @Malkudsi


