


EUR /JPY and USD/JPY Outlook
- Euro and US Dollar price against Japanese Yen charts and analysis
See Our latest trading guides for free and discover what is likely to move the markets through Q3 of this year.
USDJPY, EURJPY - Trading Lower
Last week, EUR/JPY declined for the eight week in a row then closed on Friday with 0.4% loss. Similarly, USD/JPY traded lower and closed the weekly candlestick in the red with 0.8% loss.
Yesterday, EURJPY tested its lowest level in 28 months at 116.82 however, the price pulled back and rallied above 117.00 handle. On the other hand, USDJPY neared the yearly support testing its lowest level in over eight months at 104.81 then pushed above 106.00 handle.
The Relative Strength Index (RSI) in both pairs remined flat around 40 on both pairs indicating to a weakening downtrend momentum.
Having trouble with your trading strategy? Need a hand? Here’s the #1 Mistake That Traders Make
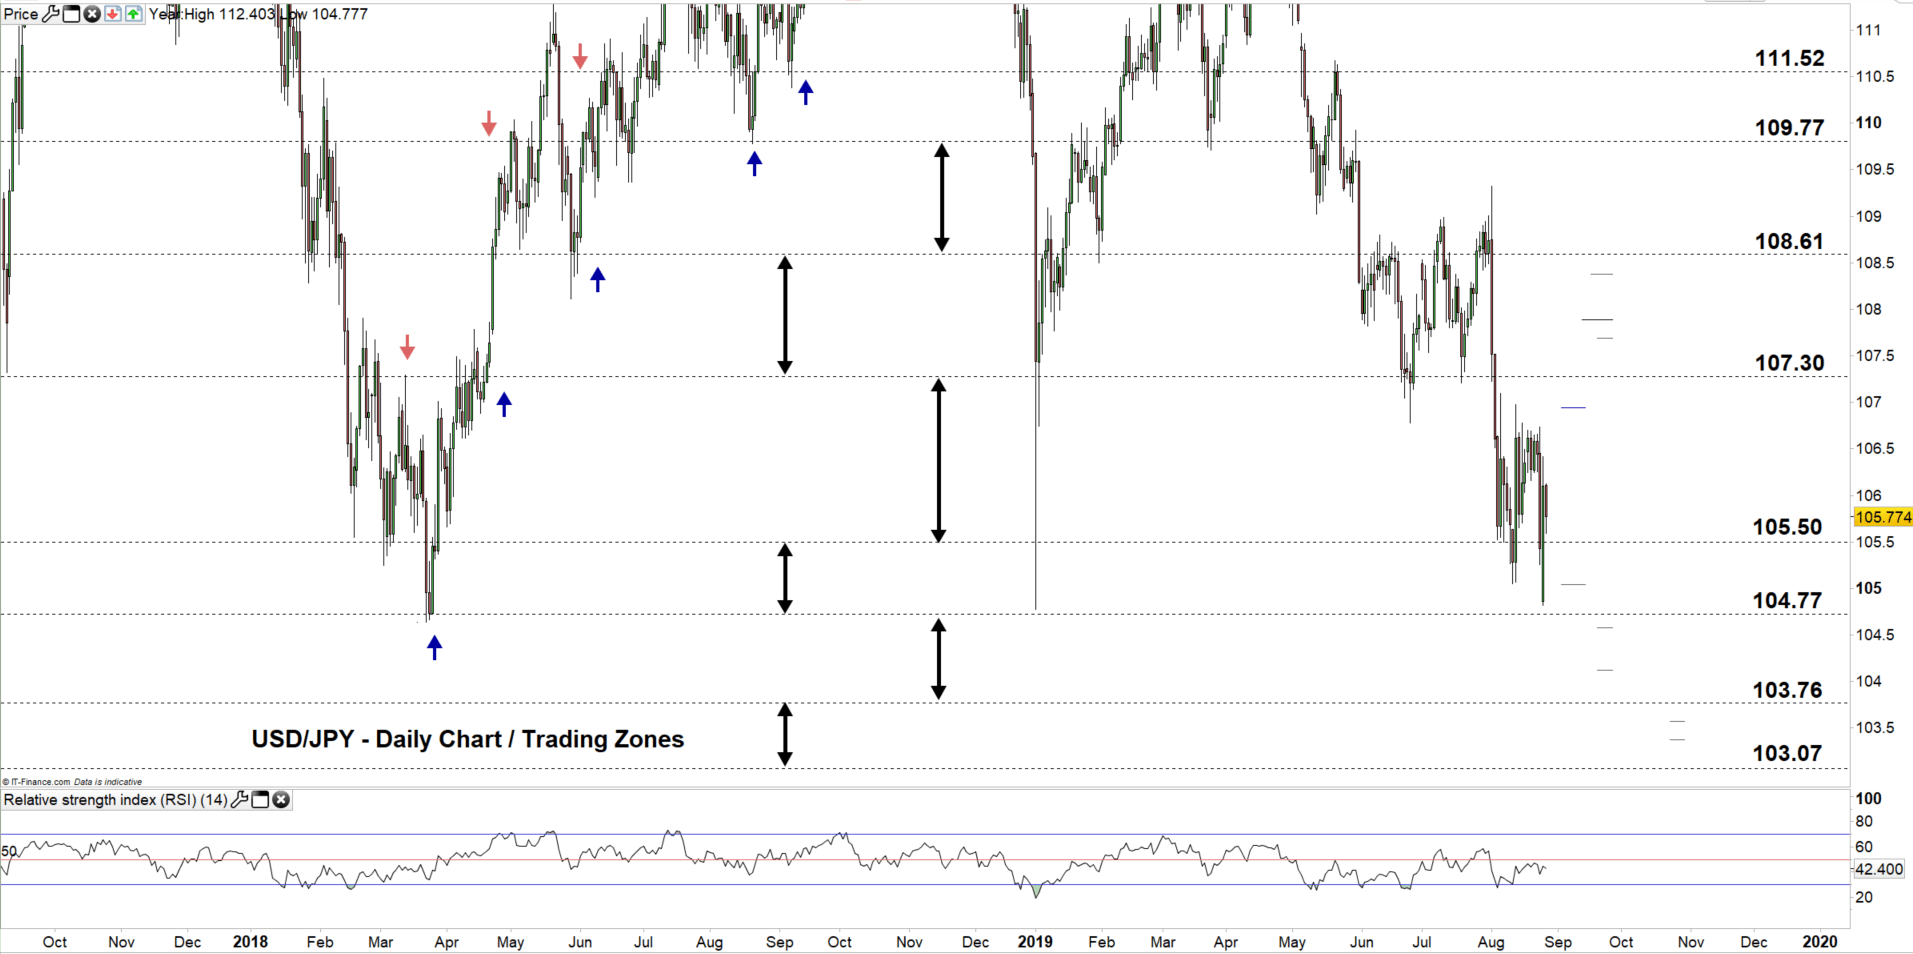
EUR/JPY Daily PRice CHART (DEC 20, 2016 - AUG 27, 2019) Zoomed Out

EUR/JPY Daily Price CHART (May 27 - AUG 27, 2019) Zoomed in
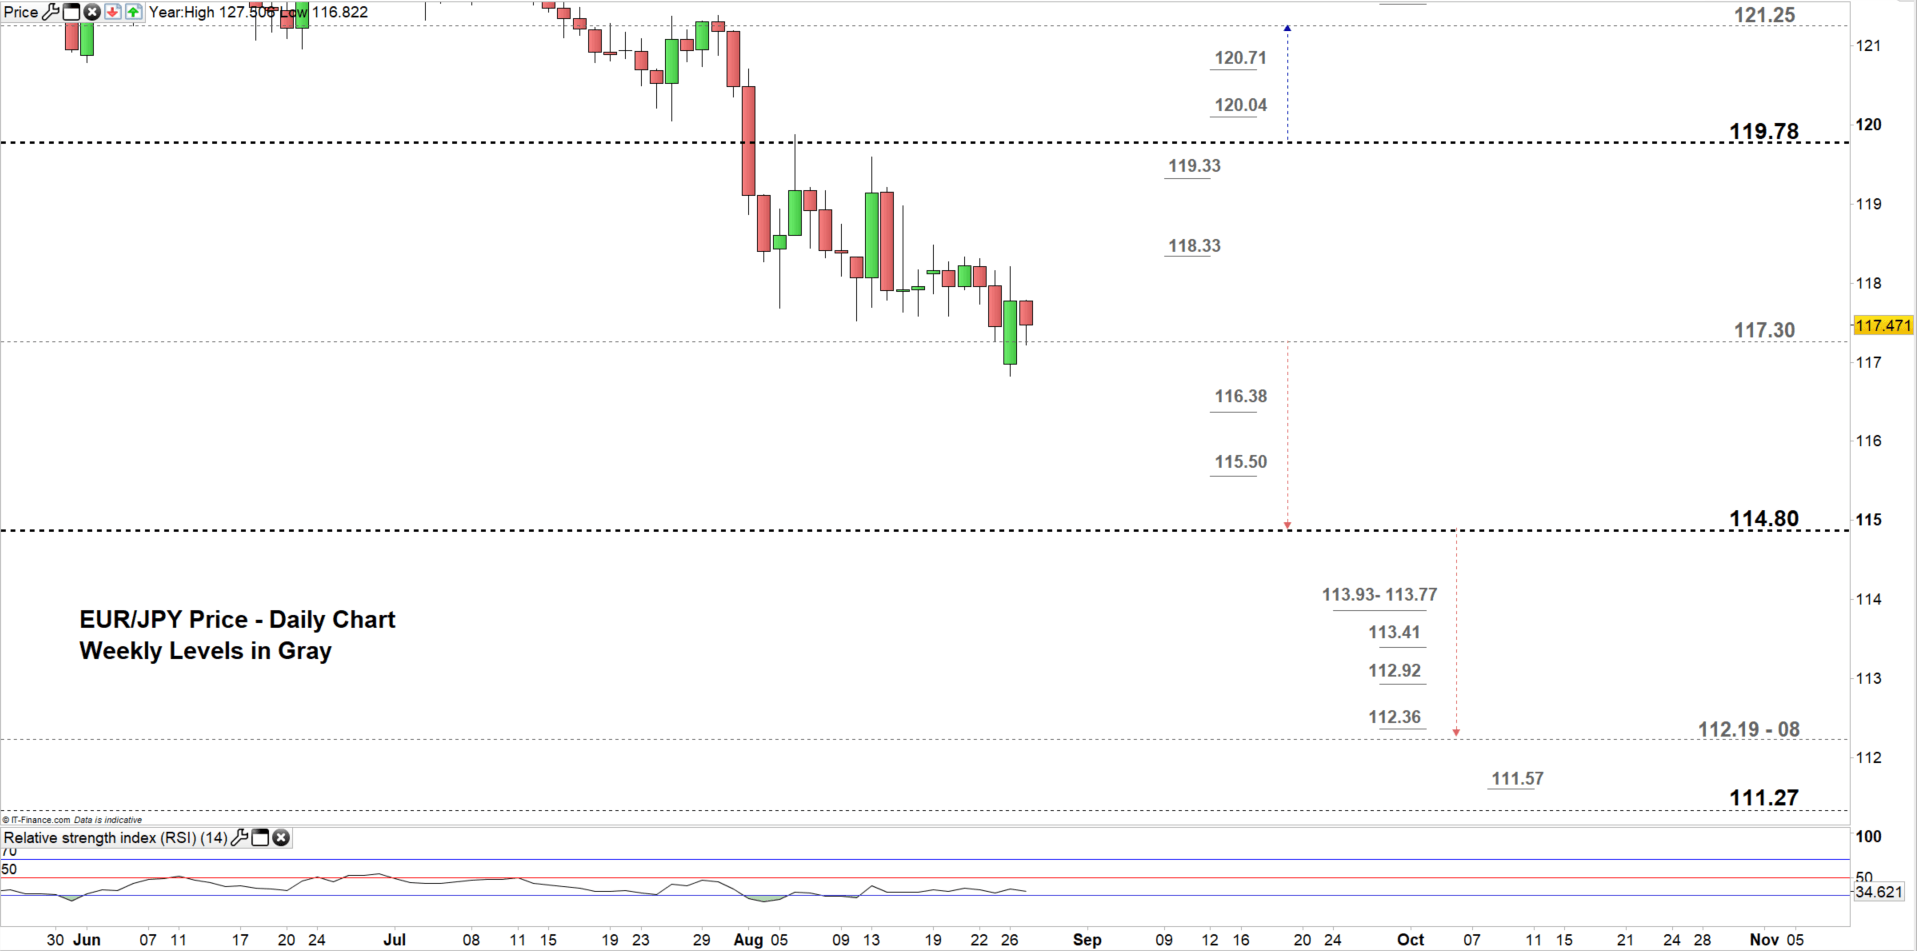
Looking at the daily chart we notice since the start of August EUR/JPY has been moving in the trading zone 117.30 – 119.78.
Yesterday, the pair failed to move to the lower trading zone hence, if sellers were successful to force a close below the low end of the zone, this could send the price towards 114.80. Although, the weekly support levels underlined on the chart (zoomed in) should be watched closely. See the chart to know more about the lower trading zone/s with the weekly support levels EURJPY would face in a further bearish scenario.
In turn, any failure in closing below the low end of the zone could cause a rally towards the high-end contingent on clearing the weekly resistance levels underscored on the chart.
Just getting started? See our Beginners’ Guide for FX traders
USD/JPY Daily PRice CHART (Sep 11, 2017– AUG 27, 2019) Zoomed Out
USD/JPY Daily PRice CHART (April 15 – AUG 27, 2019) Zoomed In
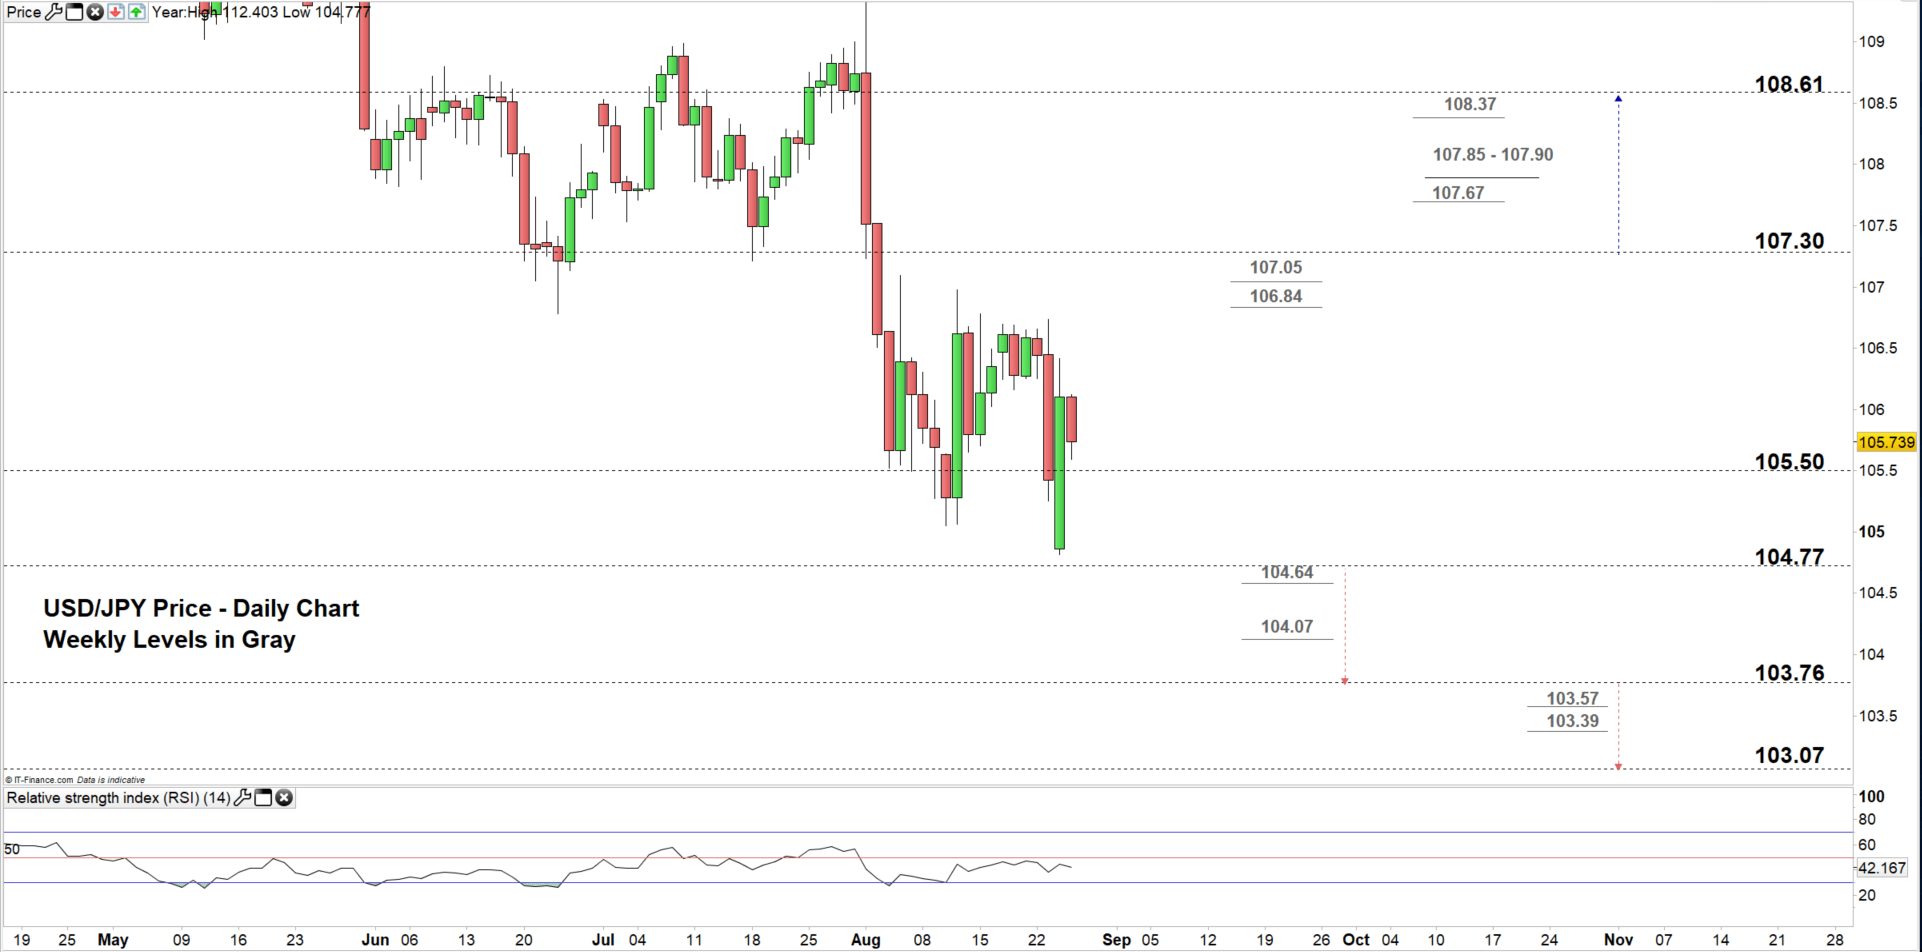
Looking at the daily chart we notice USD/JPY moved on Friday to the lower trading zone however, the pair rallied back to the zone 105.50 – 107.30 for the second time in two weeks.
Therefore, a close below the low end of current zone may send the price towards 104.77. Further close below this level could see the price trading even lower towards 103.76 although, the weekly support levels marked on the chart (zoomed in) would be worth monitoring.
On the flip-side, any failure in closing below the low end could push the price towards the high end however, the weekly resistance levels underlined on the chart should be kept in focus. See the chart to find out more about the higher trading zone and resistance levels USD/JPY would encounter in a further bullish move.
Written By: Mahmoud Alkudsi
Please feel free to contact me on Twitter: @Malkudsi


