


Market Price Outlook,
- EUR/JPY and USD/JPY Charts and Analysis
- Euro and US Dollar price action against Japanese Yen.
See Our latest trading guides for free and discover what is likely to move the markets through Q3 of this year.
Stronger US Dollar Across the Board
Last week EURJPY declined to its lowest level in over six months. However, the pair recovered all the losses and closed the weekly candlestick with a Doji pattern reflecting indecision in the market, i.e. the seller’s hesitation to keep pressing the price lower.
In turn, last week USD/JPY traded higher and printed on Friday 108.83 – its highest level in over two weeks, then closed with 0.9% profit.
Alongside this, the Relative Strength Index (RSI) remained flat moving around 40 and negating any effective momentum form the buyers nor the sellers for EURJPY. On the other hand, the oscillator pointed higher on Wednesday and crossed 50 indicating to USD/JPY buyers were gathering momentum for a possible start of upward move.
Having trouble with your trading strategy? Need a hand? Here’s the #1 Mistake That Traders Make
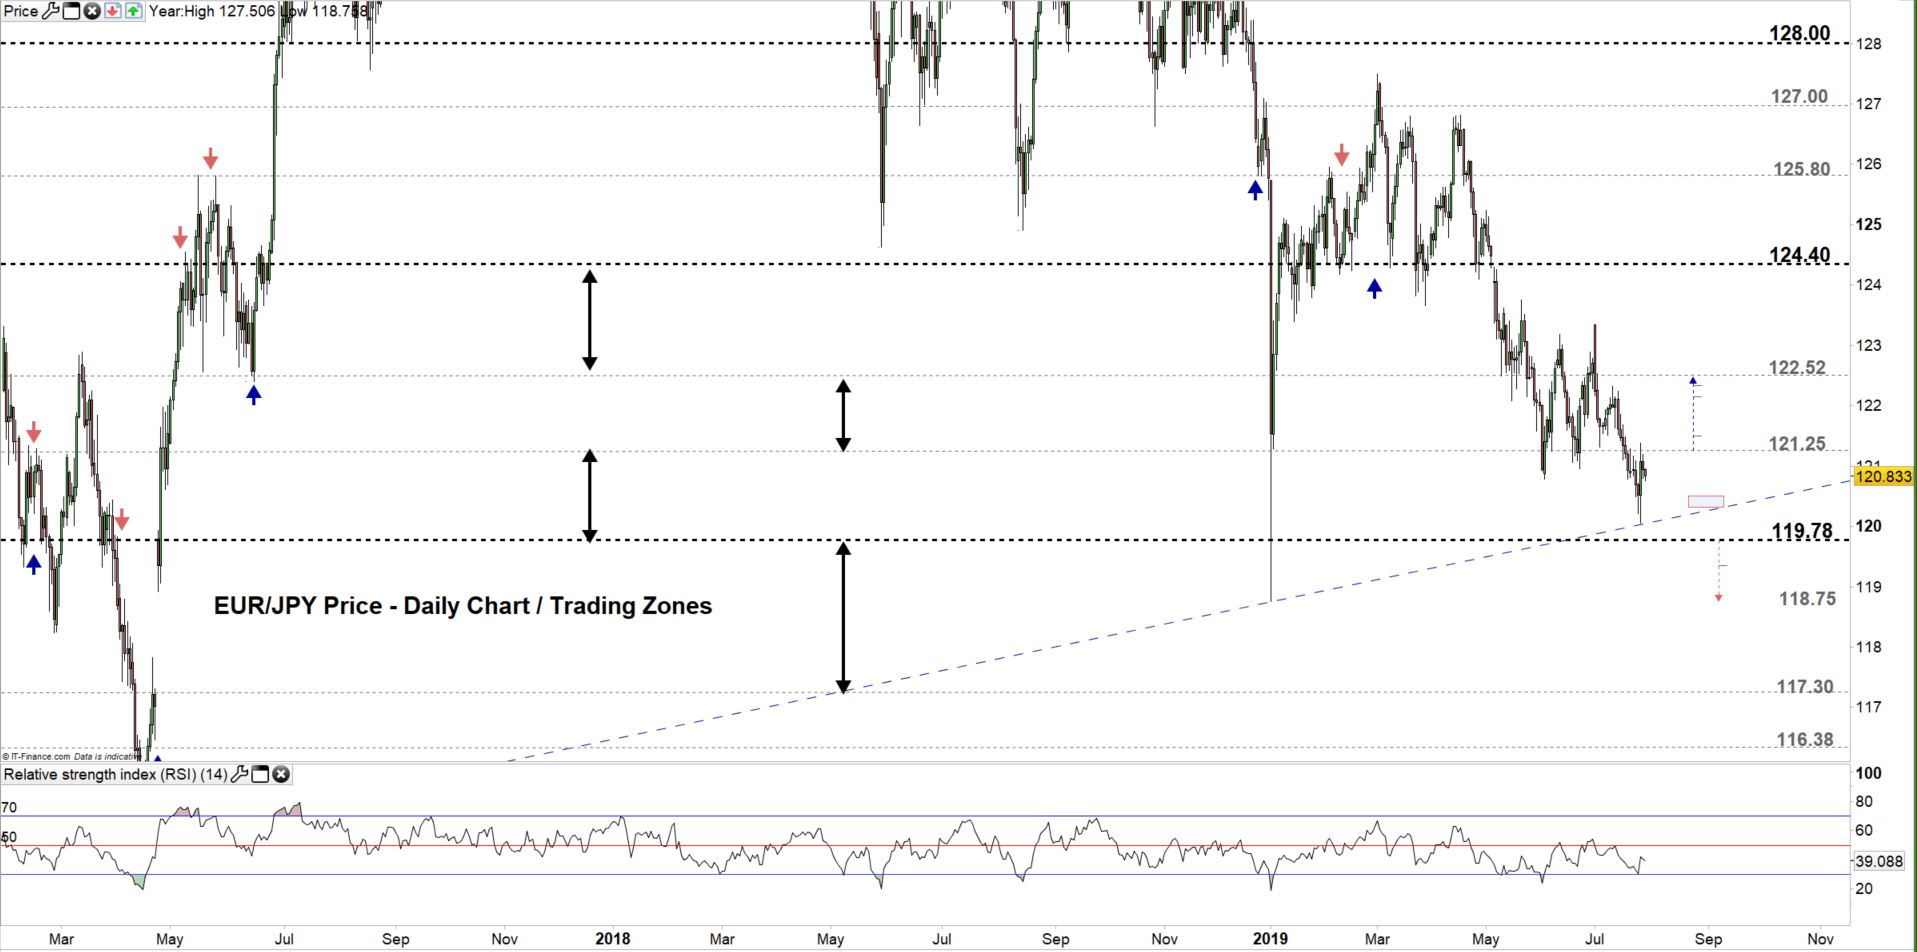
EUR/JPY DAILY PRICE CHART (Jan 15, 2017- JULY 29, 2019) Zoomed Out
EUR/JPY DAILY PRICE CHART (MAy 9 – JULY 29, 2019) Zoomed in
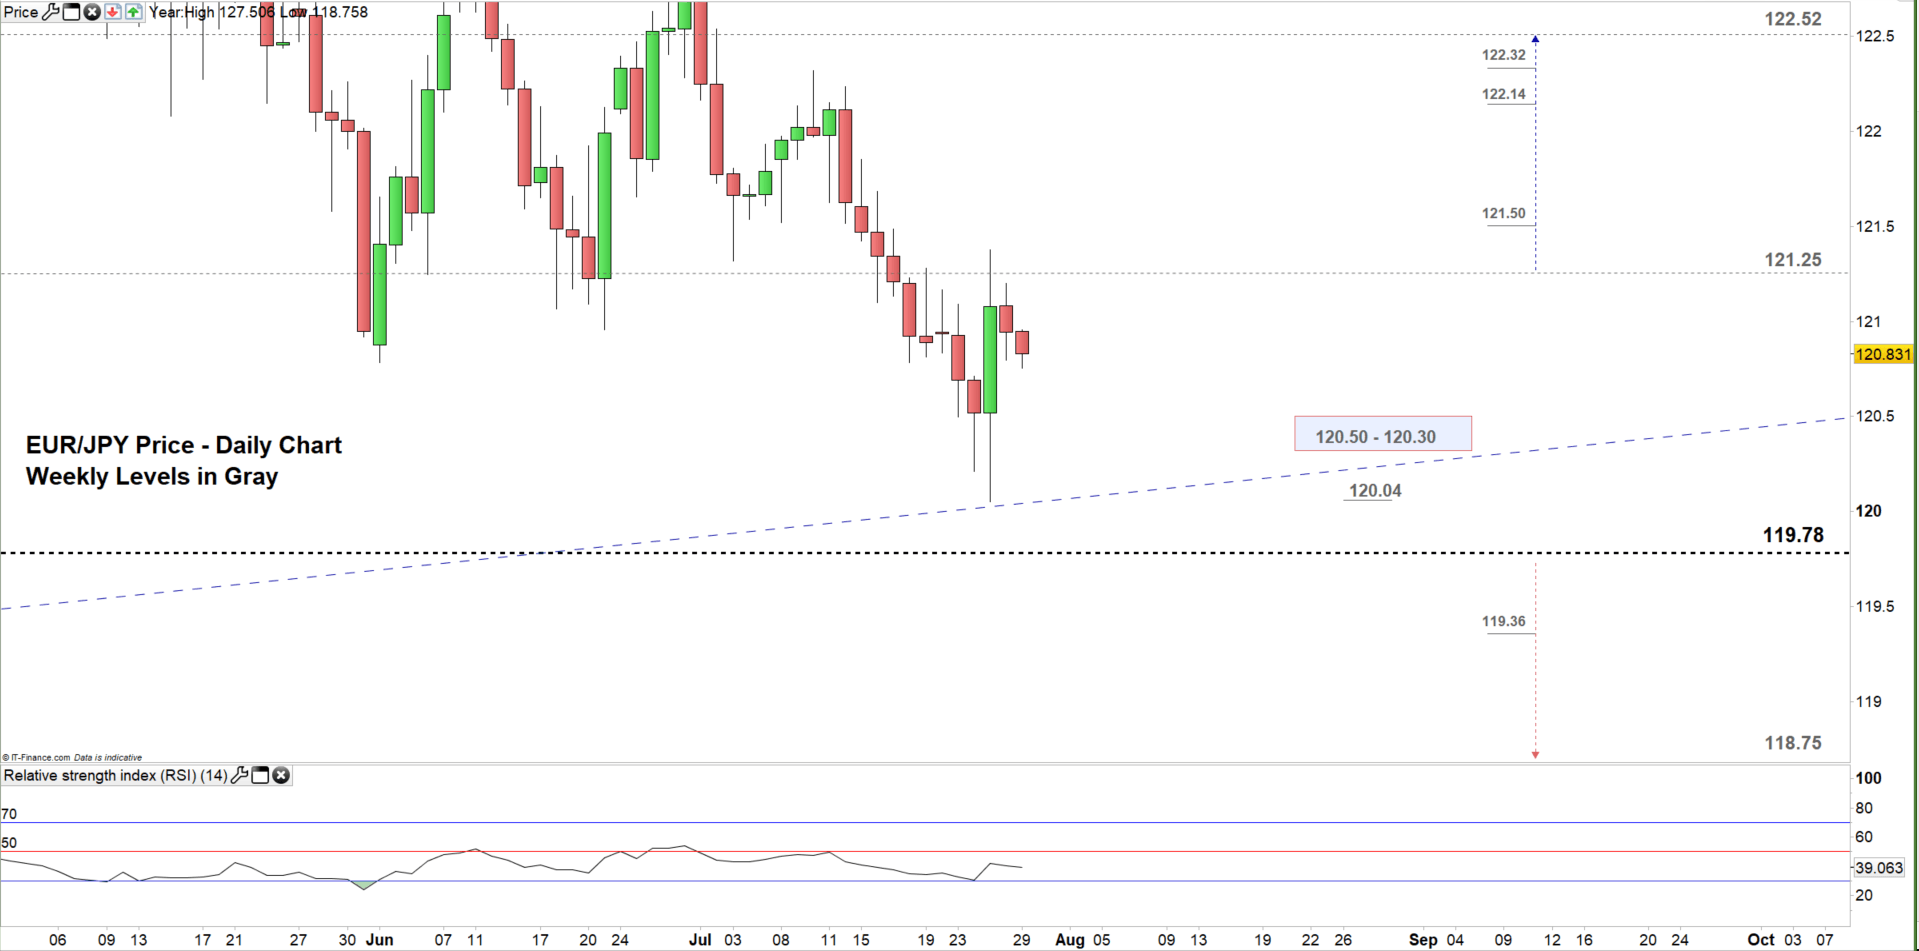
Looking at the daily chart we notice last week EUR/JPY remained the trading zone 119.78 – 121.25 after failing on Thursday to close in the higher zone. Hence, the pair currently eyes a test of the low end of this zone.
However, the daily support zone with the weekly support level marked on the chart (zoomed in) need be monitored. See the chart to know more about the lower trading zone and the weekly support if the price closes below the low end of the current trading zone.
On the other hand, a close above the high end of the zone could push the price towards 122.52. Although, the weekly resistance levels underlined on the chart (Zoomed in) should be watched closely.
Just getting started? See our Beginners’ Guide for FX traders
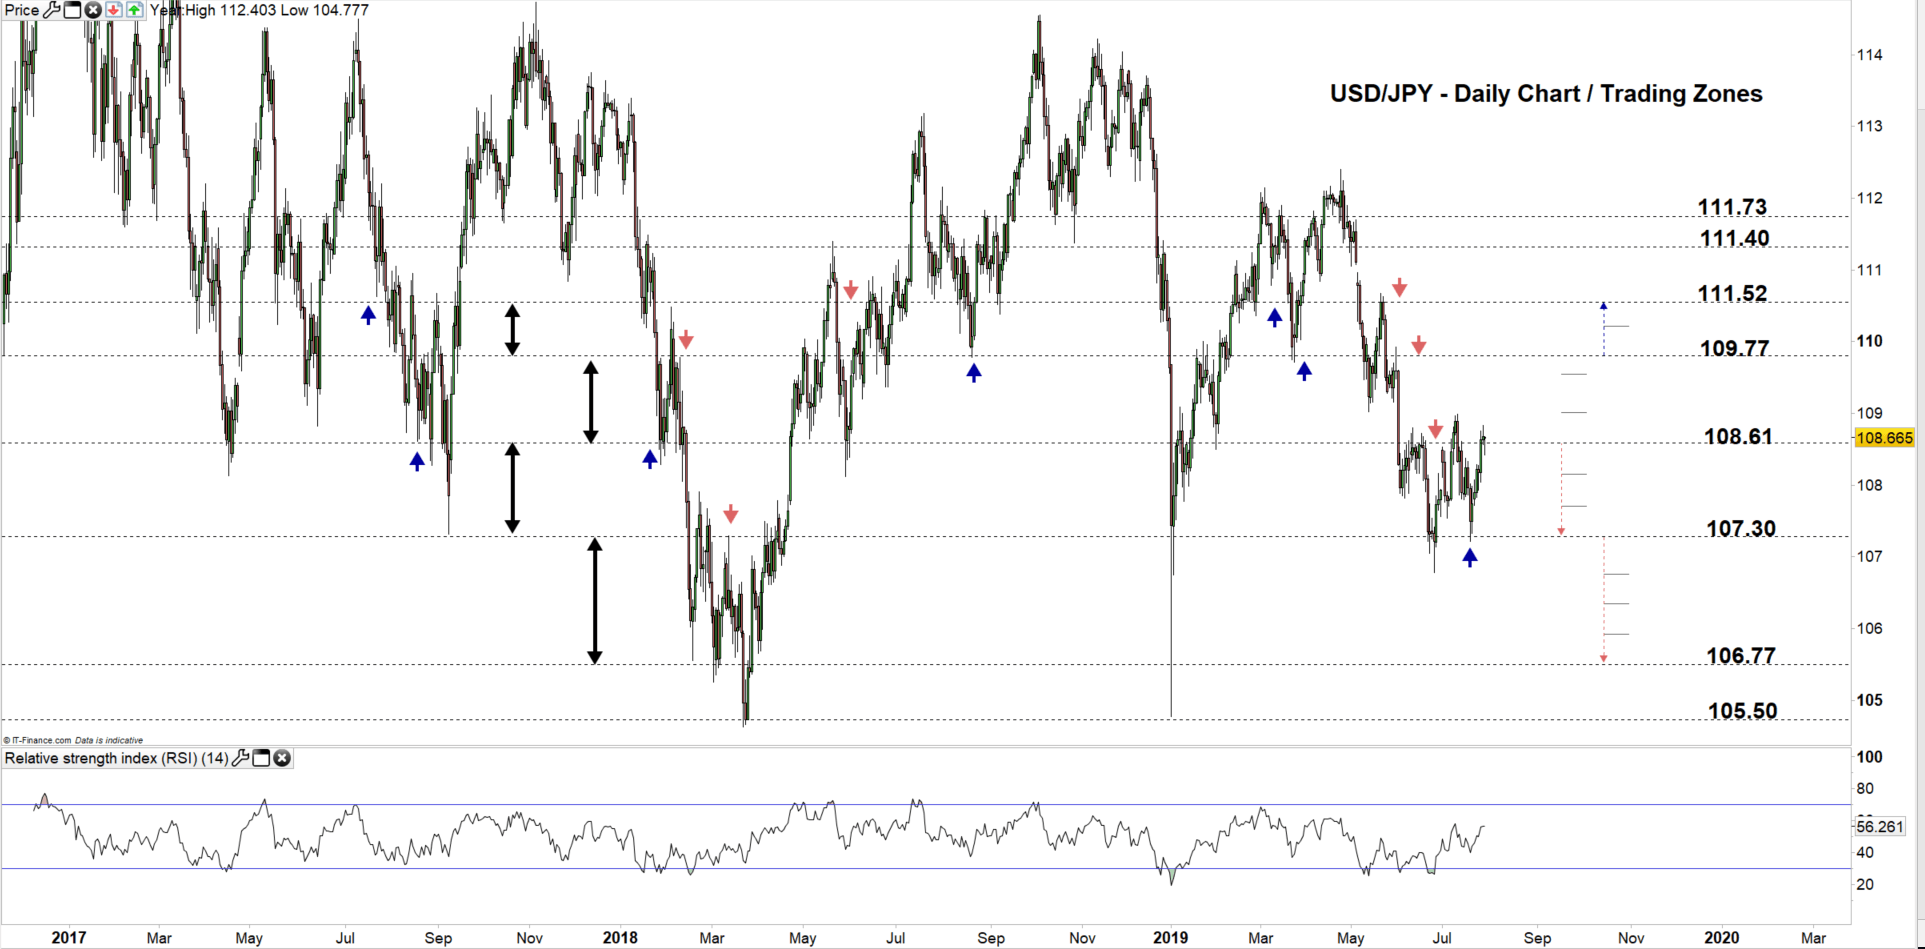
USD/JPY Daily CHART (NOv 18, 2016– JULY 29, 2019) Zoomed Out
USD/JPY Daily CHART (Jan 15 – JULY 29, 2019) Zoomed In
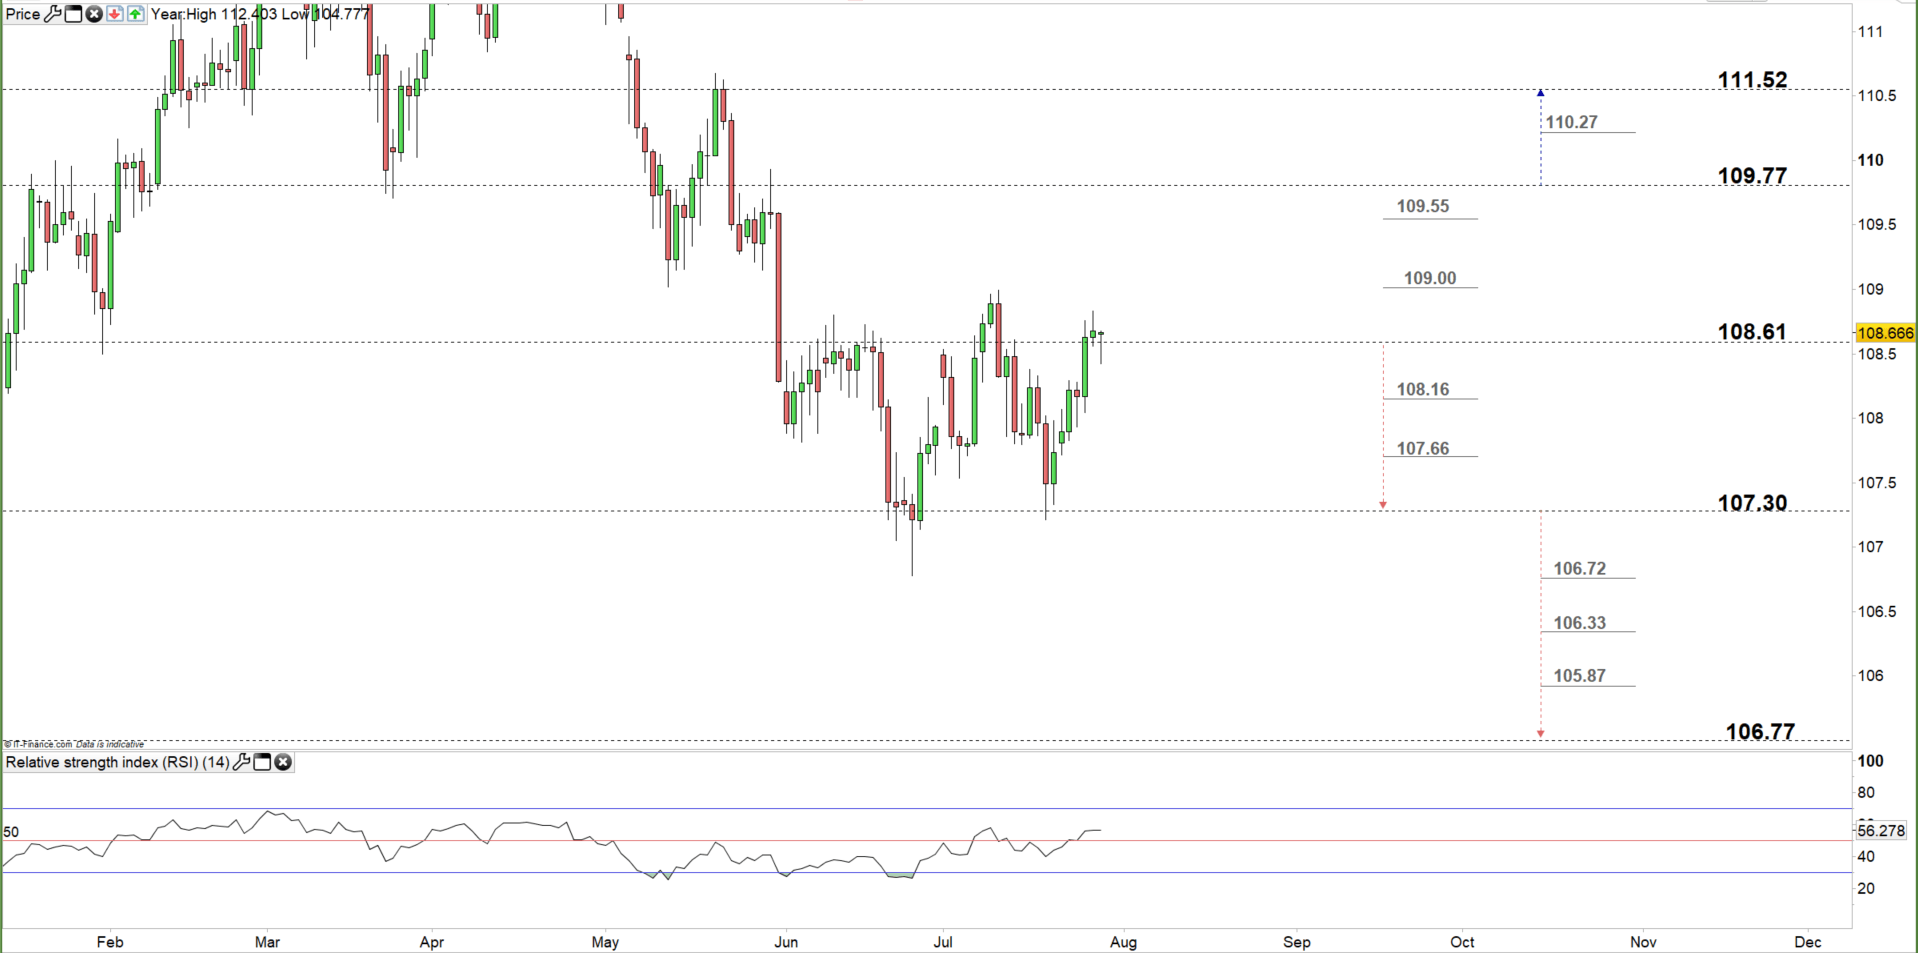
Looking at the daily chart we notice on Thursday USD/JPY closed in a higher trading zone 108.61 – 109.77 and continued to trade in this zone on Friday after rebounding from the low end. Therefore, the pair could test the high end of this zone contingent on remaining above the low end. Although, the weekly resistance levels underscored on the chart (zoomed in) need to be kept in focus.
On the flip-side, any close below the low end could send the price towards 107.30. Nonetheless, the weekly and daily support levels mentioned on the chart would be worth monitoring.
Written By: Mahmoud Alkudsi
Please feel free to contact me on Twitter: @Malkudsi


