


EUR/JPY Price Outlook
See our guides and find out for free what is likely to move market prices through Q2 from Main Currencies and Commodities Forecasts
EUR/JPY– Sellers hesitation
On June 18 EUR/JPY daily candlestick closed with a long wick indicating to hesitation from the sellers to press the price lower. On the following days hesitation signs continued so the buyers took the initiative on June 21 and rallied the price recovering all the weekly losses.
On June 21 the Relative Strength Index (RSI) pointed higher moving from 35.5 to 45.5 reflecting the weakness in the bearish momentum. It’s worth noting that a cross above 50 indicates to a possible start of an uptrend.
Having trouble with your trading strategy? Here’s the #1 Mistake That Traders Make
EUR/JPY DAILY PRICE CHART (FEB 27, 2019- JUN 3, 2019) Zoomed IN

EUR/JPY DAILY PRICE CHART (NOV21, 2016 – JUN24, 2019) Zoomed OUT

Looking at the daily chart we notice EUR/JPY opened today on an upward gap eying to test 122.52. Any close above this level would move the price to the higher trading zone (122.52 – 124.40) and could send the pair to test the neckline of the double bottom pattern residing at 123.18.
If EUR/JPY breaks and remains above the neckline it could rally towards 124.54 however, the weekly resistance highlighted on the chart need to be kept in focus.
In turn, any failure to close above 122.52 may lead EUR/JPY towards 121.25. Further bearishness might need a close below 121.25. This means the price could head towards 119.78. Although, weekly supports mentioned on the chart need to be watched along the way.
Just getting started? See our Beginners’ Guide for FX traders
EUR/JPY Four-HOUR PRICE CHART (May 16, 2019 – JUNE 24, 2019)
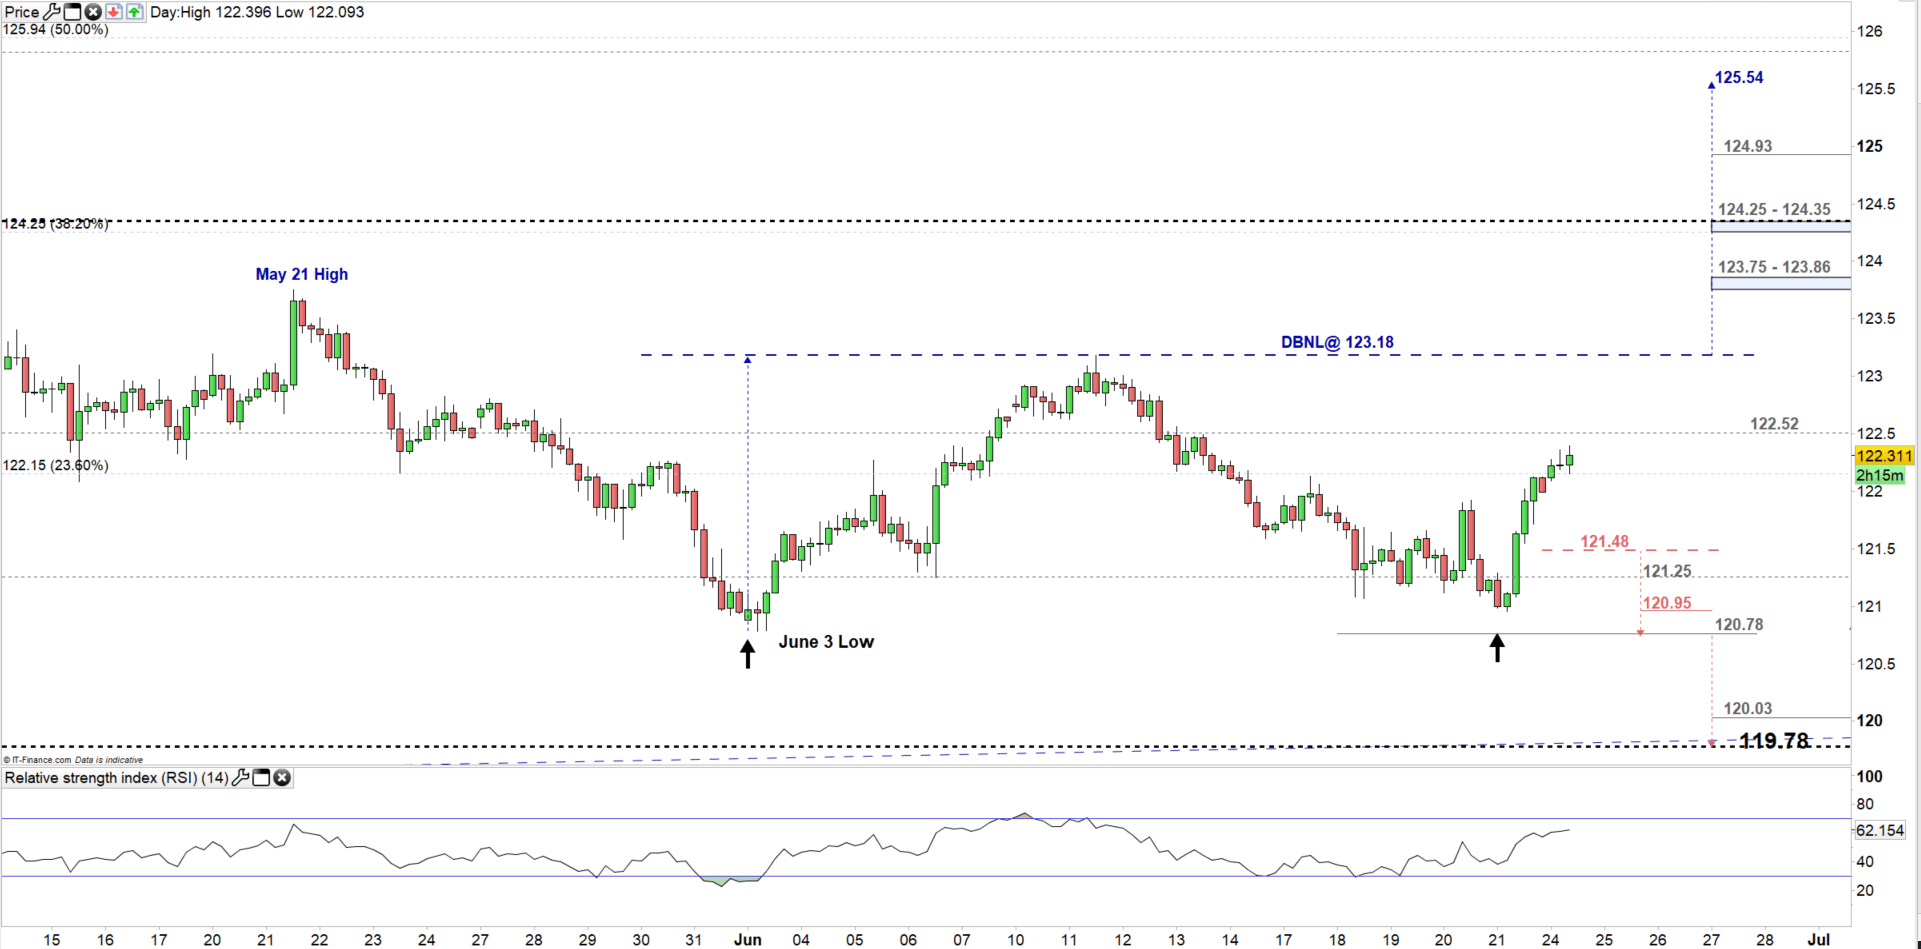
Looking at the four-hour chart, we notice EU/JPY rebounded from 120.95 on Jun 21. The pair rallied today breaking above 23.6% Fibonacci retracement at 123.15 and could be on course to test the aforementioned neckline.
If EUR/JPY breaks and remains above the neckline, this could start a movement towards the zone from 38.2% Fib retracement at 124.25 up to 124.35. However, the weekly resistance zone highlighted on the chart needs to be considered.
On the flipside, if EUR/JPY breaks below 121.48 it might head to tests the June 3 low at 120.78 contingent on clearing the daily and weekly support levels underlined on the chart. See the chart to know more about the significant supports if the selloff continues below the June 3 low.
Written By: Mahmoud Alkudsi
Please feel free to contact me on Twitter: @Malkudsi


