


EUR/JPY Price Outlook
See the Q2 Euro forecast to learn what is likely to drive price action through mid-year!
See the DailyFX Economic Calendar for a comprehensive look at all next week’s data releases.
Having trouble with your trading strategy? Here’s the #1 mistake that traders make
EUR/JPY Daily Price Chart (May 2018 – May 14, 2019)
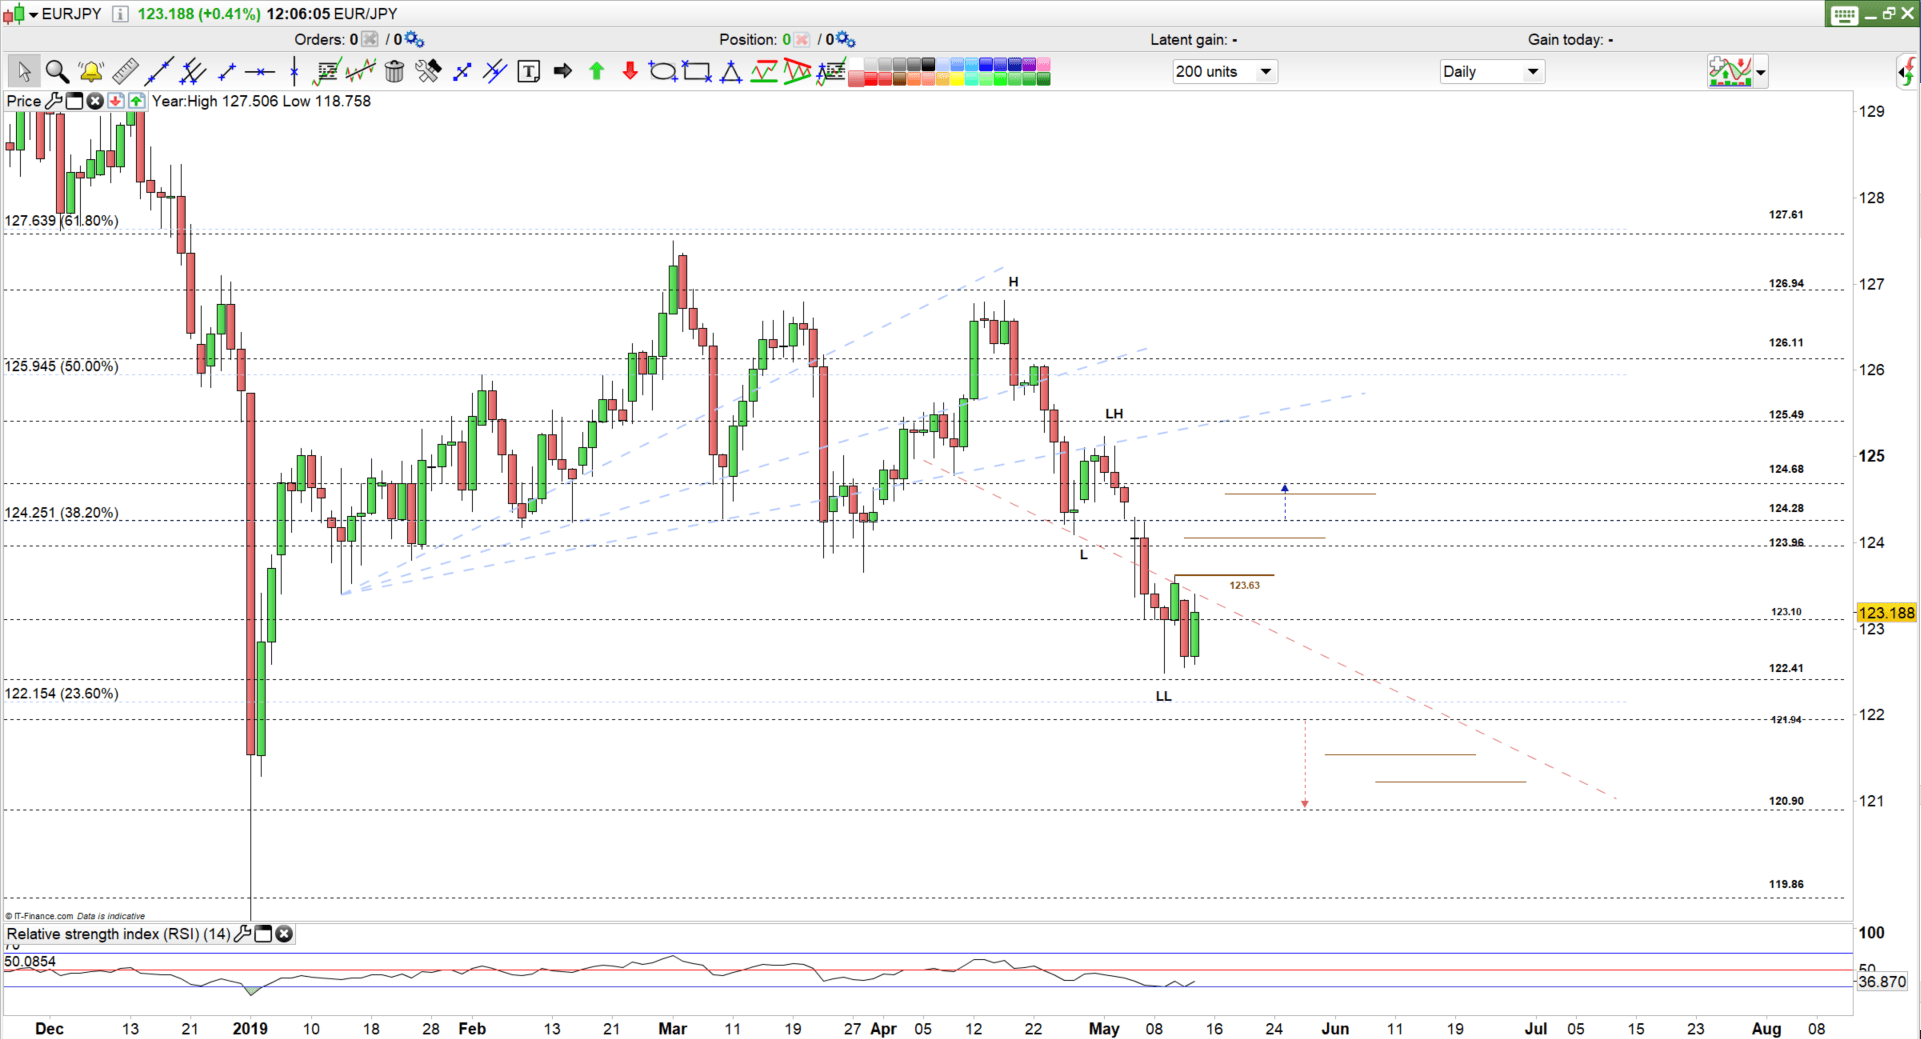
Trading around 123.10 with hints of weakness in bearish momentum
On May 6, EUR/JPY opened with a downside break-away gap, showing more momentum for the price to trade lower. On the following day the pair broke below 123.96, hinting towards 123.10 where it found support and rebounded. On May 9, EUR/JPY broke below 123.10 and the selloff stopped around the levels mentioned in last week’s article and began pulling back the same day. Read more in Trading above and below 123.05 – levels to watch
Yesterday, sellers again pushed EUR/JPY below 123.10, however; they failed to take the price to the lower end of the trading range located at 122.41 and below the May 9 low at 122.48, indicating weakening bearish momentum. This was also demonstrated in the Relative Strength Indicator (RSI), which rebounded twice from oversold territory between May 9 and 13, highlighting diminishing bearish momentum.
To Summarize: The downtrend of the pair was confirmed since the start of last week, but sellers are showing hesitation at this stage. Unless the price breaks below 122.41 the bearish movement could continue towards 121.94, contingent on clearing the 23.6% Fibonacci retracement at 122.12. Also, a close below 121.94 could entice EUR/JPY to swing lower towards 120.90. Support levels at 121.54 and 121.23 may be worth monitoring.
How EUR/JPY would correct its downtrend movement?
If the pair keeps trading below the downtrend line starting from the April 10 low it will be difficult to talk about a price correction, however; if the price closes above 123.40 that may start a rise towards 124.28. In this case, resistance levels at 123.63, 123.96, and 124.04 need to be watched along the way.
Just getting started? See our beginners’ guide for FX traders
EUR/JPY Prices 2Hour Chart (May 14, 2019)

Bullish Potential Above 123.63
Today, price broke above the downtrend line emerging from the May 7 high; if price breaks below 123.10 it could swing lower towards 122.80. Support levels at 123.03, 122.92 and 122.84 are in focus.
On May 10, EUR/JPY bounced from 123.61, printing its highest level in three days, therefore if the price breaks above this high a bullish sentiment may push the price towards the vicinity of 124.26 -28. Other levels to consider 123.77, 123.87, and 124.09.
Written By: Mahmoud Alkudsi
Please feel free to contact me on Twitter: @Malkudsi


