


ASX 200 Technical Analysis Talking Points:
- The index has bounced at support from mid-May
- However, it has yet to regain an important trading band
- Time may be running out for it to do so.
Find out what retail foreign exchange traders make of the Australian Dollar’s chances right now at the DailyFX Sentiment Page.
The ASX 200 has found a measure of stability after the sharp falls seen in early August. However, the technical signals remain discouraging and an early return to last month’s record highs doesn’t look likely in the near term,
The Australian equity benchmark suffered fundamentally as did most global indexes from the US stock rout which came after Donald Trump announced yet more tariffs on Chinese imports back on August 2. That fall was in the ASX’s case arrested by a layer of support from mid-late May in the 6578 region.
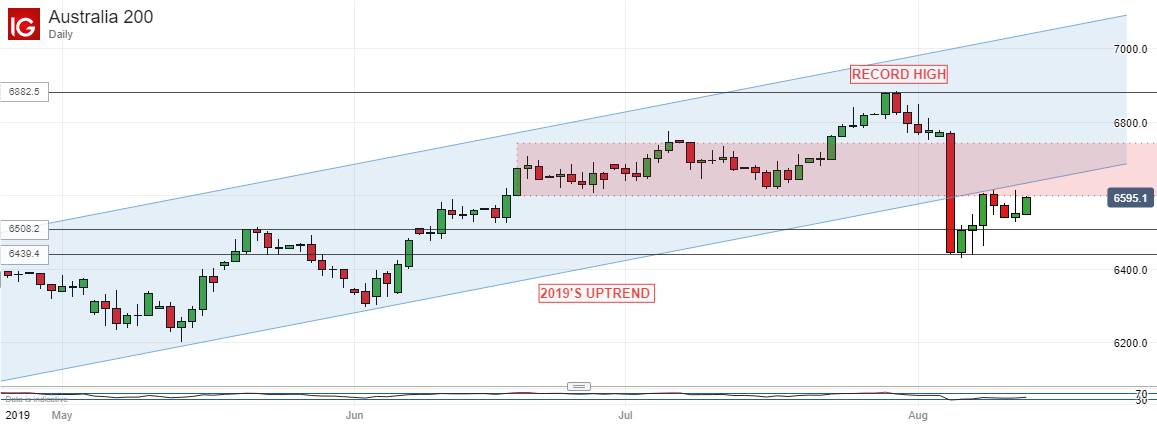
That support has held so far but the fightback since has been rather unimpressive compared to the magnitude of the falls which preceded it. The bulls have yet to nudge the index back into the important trading band which bounded proceedings between mid-June and July 23. It was important as the springboard from which that record high was achieved, and now looks important again as resistance as can be seen in red on the chart above.
Bulls will need to break back into that zone with a daily close above 6,600 and, ideally, keep the market above that level if they’re going to manage any serious damage limitation. The longer that task eludes them, the more likely it will become that the market will top out again around current levels and put more focus on the downside.
Still, the ASX has been astonishingly resilient above the psychologically crucial 6,000 mark in 2019, a point above which it had previously spent very little time for more than ten years. That there’s been no headlong rush below it may be encouraging but the bulls may not have long to make their case before that level comes into play again.
For the moment reversals below August’s lows are likely to bounce in the 6379.4 area. That will represent the second, 38.2% Fibonacci retracement of 2019’s overall rise. Below that lurks the more threatening 50% retracement at 6223.8, but that looks safe enough from the bears at this point.
For the moment it probably makes sense to see how the market fares with that key resistance zone.
ASX 200 Resources for Traders
Whether you’re new to trading or an old hand DailyFX has plenty of resources to help you. There’s our trading sentiment indicator which shows you live how IG clients are positioned right now. We also hold educational and analytical webinars and offer trading guides, with one specifically aimed at those new to foreign exchange markets. There’s also a Bitcoin guide. Be sure to make the most of them all. They were written by our seasoned trading experts and they’re all free.
--- Written by David Cottle, DailyFX Research
Follow David on Twitter @DavidCottleFX or use the Comments section below to get in touch!


