


ASX 200 Technical Analysis Talking Points:
- The ASX 200 has reached 12-year highs
- A push on from here would be most impressive
- However the benchmark may be exhausted and ready for some consolidation, perhaps at least
Find out what retail foreign exchange traders make of the Australian Dollar’s chances right now at the DailyFX Sentiment Page.
The ASX 200 is not doing badly out of a period of trade-related risk appetite which has hit other markets. The Sydney equity benchmark reached highs not seen since late 2007 last week as a range of fundamental factors combined to lift it.
Rising iron ore prices played their part, with Australia’s primary commodity export bolstered by news of inventory drawdowns at Chinese ports. A weaker local currency also seems to have boosted the attraction of Australian stocks to international investors, with growing suspicions that record-low interest rates could soon go lower helping too.
Technically speaking the ASX has regained the impressive daily-chart uptrend channel which held from early February and which is in any case only an extension of the long rise up from the lows of late November. Mid-May’s break below the channel bottom now looks entirely spurious.
Still, it’s worth pointing out that the channel top has not faced a stern upside test for quite some time, since early March in fact. Moreover, it looks as though an ‘evening star’ formation can be seen there much more recently, between March 21 and 23.
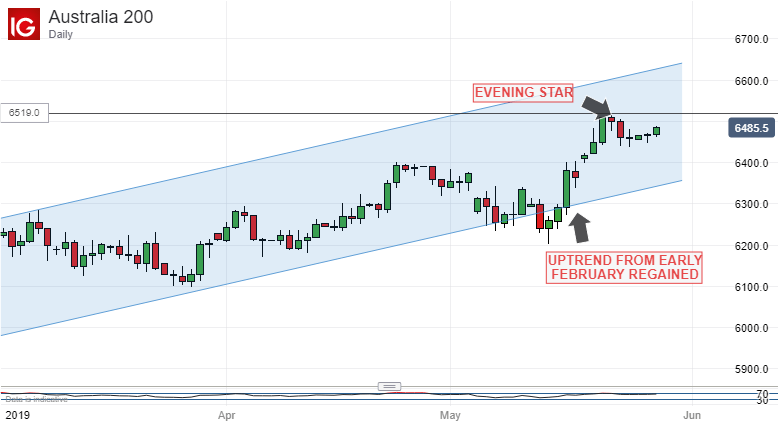
This could well suggest that the uptrend is entering a period of significant exhaustion and, although the price action since has not unequivocally backed this thesis, a series of narrow daily ranges is clearly visible since, suggesting at least a degree of uncertainty in this market.
Reverses are likely to find initial support around late April’s highs in the 6837 region. If these contain the bears then investors may consider a near term test passed and push back to last week’s significant peaks. If they don’t, however,r then it might be as well to expect yet another downside channel test.
Support there would come in at 6336 or so, but even that would probably be comfortingly north of the 6000 mark which has so often proven psychologically crucial for this index.
It’s notable too that the two levels mentioned about match very closely the first and second Fibonacci retracements of the rise up from early February. The third comes in at 6188.9, but a test of that would entail a clear break of the uptrend channel and probably suggest a deeper reversal.
Resources for Traders
Whether you’re new to trading or an old hand DailyFX has plenty of resources to help you. There’s our trading sentiment indicator which shows you live how IG clients are positioned right now. We also hold educational and analytical webinars and offer trading guides, with one specifically aimed at those new to foreign exchange markets. There’s also a Bitcoin guide. Be sure to make the most of them all. They were written by our seasoned trading experts and they’re all free.
--- Written by David Cottle, DailyFX Research
Follow David on Twitter @DavidCottleFX or use the Comments section below to get in touch!


