


ASX 200 Technical Analysis Talking Points:
- The ASX 200 made a new 2019 high last week
- It hasn’t fallen far since either
- That said an evening star pattern has been formed that should worry the bulls
Get live, interactive coverage of all major Australian economic data at the DailyFX Webinars
The ASX 200 sits close to six-month highs and seems reasonably comfortable at altitude, but there are some clear technical warning signs which traders might do well to heed.
The Sydney equity benchmark managed its 2019 peak last Thursday and, while it hasn’t fallen far since, in doing to it made an evening star pattern on the chart which could be a bad sign for the bulls. That pattern can be seen in the daily candles of March 6-8, where the characteristic rise, slip and fall for consecutive days are clearly seen.
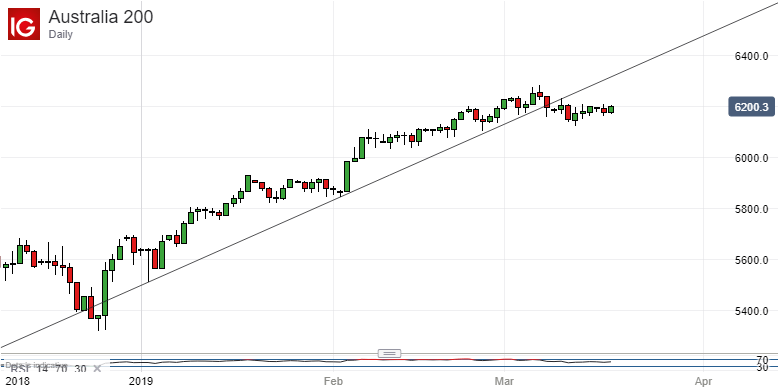
An evening star is a bearish reversal pattern, suggesting falls ahead. In this case that possibility is only compounded by the fact that March 8’s down day took the index below an uptrend line which had previously held all year.
Still, there may yet be cause for hope. So far, the index has refused to collapse. Indeed, it remains above even the first Fibonacci retracement of this year’s rise. That comes in well below the market at 6057.6. Should that give way then there may well be some impetus behind a bearish trade which would abandon the psychologically crucial 6,000 level and put the second retracement at 5916 in focus. But we are not there yet.
First support is likely to be found at the recent lows in the 6120 region and, while these hold bulls can hope that the influence of the evening star may not be severe. Should they give way however then it might be as well to play for a deeper retracement and to be protected against another slip below the 6000 point.
Resources for Traders
Whether you’re new to trading or an old hand DailyFX has plenty of resources to help you. There’s our trading sentiment indicator which shows you live how IG clients are positioned right now. We also hold educational and analytical webinars and offer trading guides, with one specifically aimed at those new to foreign exchange markets. There’s also a Bitcoin guide. Be sure to make the most of them all. They were written by our seasoned trading experts and they’re all free.
--- Written by David Cottle, DailyFX Research
Follow David on Twitter @DavidCottleFX or use the Comments section below to get in touch!


