


ASX 200 Technical Analysis Talking Points:
- The ASX 200 has broken its downtrend and made new 2018 lows in the past three trading sessions
- While volatility is typical at year end, this looks quite extreme
- The fate of a new trading band may be key for short-term direction
Get live, interactive coverage of all major Australian economic data at the DailyFX Webinars
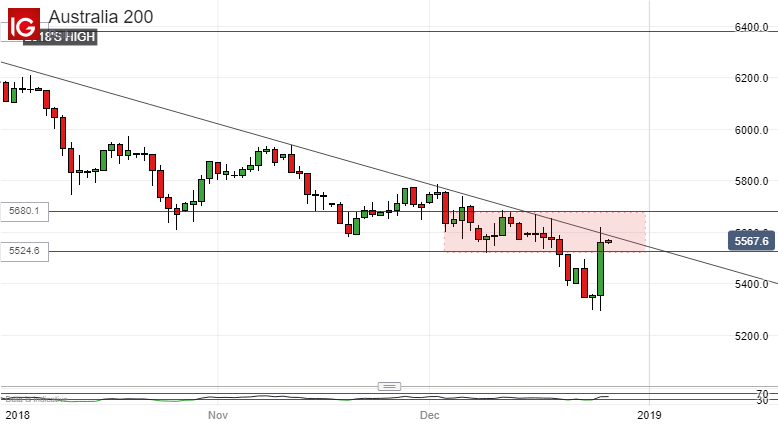
The ASX 200 is enduring a torrid end to the year, in common with many other developed market indexes. The past four daily sessions have seen the Australian benchmark plumb new lows for the 2018 and, on an intraday basis at least, break the downtrend dominant since early October.

It will be most interesting to see whether the index can get above that downtrend line for a daily, weekly or monthly close. However, even if it should, respite is likely to be only temporary as all the usual seasonal caveats about thin markets and volatility will apply and the broader downtrend looks quite entrenched.
In the short term much may depend on the fate of a trading range which is coming tentatively back into play. Its lower bound is marked by 5524,6, the intraday low of December 10, while its upper limit comes in at 5680.1, Dec 12 and 17’s top.
If ASX bulls can keep the index within this band then they might be able to force some consolidation before we get to January 31. However, even so close to the year’s lows, the index does not look egregiously oversold and they may well have their work cut out to defend that range.
Should it give way then a return to those lows will probably be seen in short order, along with the re-emergence of that downtrend – its break would then look entirely spurious.
However, if the index remains within or above that range then it could retest the previous significant peaks at 5773. Even of it does, however, this would probably only offer investors a better opportunity to go short, with the longer-term path of least resistance very likely still to the downside.
Resources for Traders
Whether you’re new to trading or an old hand DailyFX has plenty of resources to help you. There’s our trading sentiment indicator which shows you live how IG clients are positioned right now. We also hold educational and analytical webinars and offer trading guides, with one specifically aimed at those new to foreign exchange markets. There’s also a Bitcoin guide. Be sure to make the most of them all. They were written by our seasoned trading experts and they’re all free.
--- Written by David Cottle, DailyFX Research
Follow David on Twitter @DavidCottleFX or use the Comments section below to get in touch!


