


ASX 200 Technical Analysis Talking Points:
- The ASX 200 remains in retreat
- However, this month’s significant lows seem to be holding
- Their fate could be an important directional clue
Get live, interactive coverage of all major Australian economic data at the DailyFX Webinars
The ASX 200’s retreat from the key 6000 level has stalled at an interesting point whose fate could be crucial for near-term direction.
Having topped that psychologically important point back in May of this year, the Sydney stock benchmark went on to add another 400 points or so, taking it up in August to peaks not seen for more than ten years.
However it has since retreated back under 6,000 and then shed yet another 400 points, giving us about as much room between current levels and 6000 as there is between 6000 and that ten–year peak.

For the moment, support at 5583.4 is the limit of the bears’ downward push. That was the intraday low of November 20 and it has held since.
It’s also the lowest point the index has plumbed since December 21, 2016.
However, to see its true significance we have to abandon daily-tick charts such as the one above and think a little bit bigger.
This monthly chart shows that the index has in fact stalled very close indeed to the first, 23.6% Fibonacci retracement of the long post-crisis rise up from the lows of March 2009 to the peaks of this year.
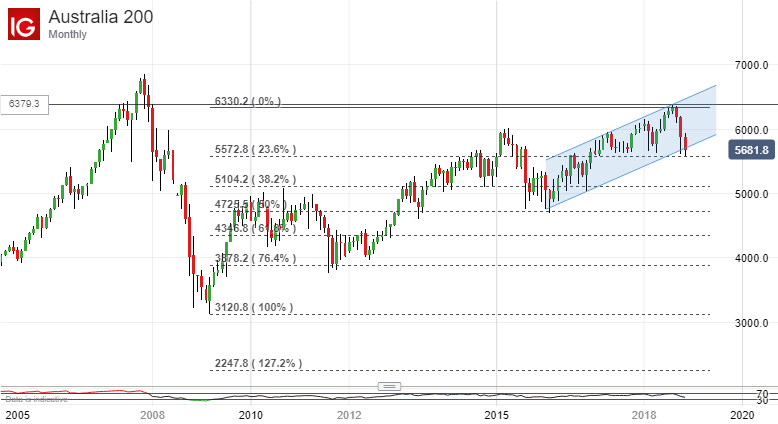
That comes in at 5572.8.
As you can also see from the chart above the index is flirting with a break below an uptrend channel previously dominant since February 2016. If confirmed on a monthly close (and we haven’t long to wait to check that), this would seem to be an unambiguously bearish signal, perhaps arguing for a retest of the next retracement level, 5104.2, in the first half of 2019.
If on the other hand that first retracement support holds then maybe the bulls can build something of a base around current levels. However, it does not look likely that they’ll be able to recapture the 6000 level any time soon, and the ASX is probably heading into this year’s end with a bearish bias.
This month’s end could give us a vital clue as to just how gloomy that bias might be.
Resources for Traders
Whether you’re new to trading or an old hand DailyFX has plenty of resources to help you. There’s our trading sentiment indicator which shows you live how IG clients are positioned right now. We also hold educational and analytical webinars and offer trading guides, with one specifically aimed at those new to foreign exchange markets. There’s also a Bitcoin guide. Be sure to make the most of them all. They were written by our seasoned trading experts and they’re all free.
--- Written by David Cottle, DailyFX Research
Follow David on Twitter @DavidCottleFX or use the Comments section below to get in touch!


