


Talking Points:
- The ASX 200 saw four months’ gains wiped out by this week’s falls
- A base has emerged at a key retracement level
- But it’s too early to be certain that it can hold
Are you new to financial market trading? Take a look at the free DailyFX trading guide s!
The ASX 200 has been rudely bounced by this week’s global equity slide out of the trading rang which had formerly endured since January 9.
Tuesday’s 179-point fall was the worse one-day showing since September, 2016, with more than four months of gains erased in the three days between Friday of last week and Tuesday of this.
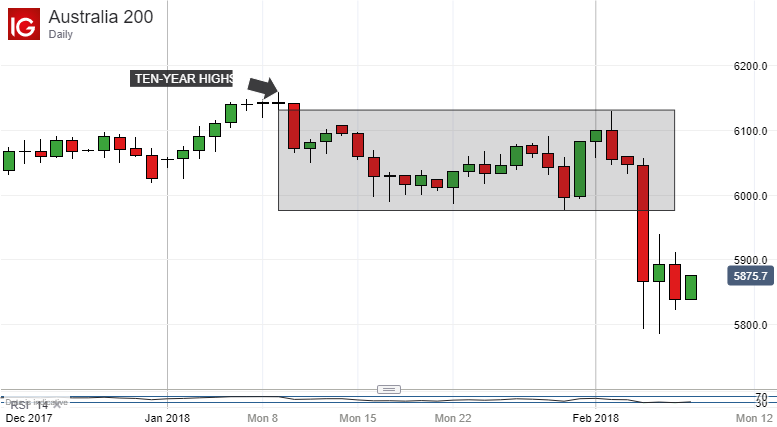
It also pushed the index decisively below the psychologically crucial 6000-point mark. The index had held above that point on a daily close basis since December 7, with the exception of January 30’s finishing level which took it just a whisker below.
Bulls will want to get that 6000 point back into play as soon as possible but it might be a mistake on their part to concentrate too much on this week’s sharp falls. That’s because, sadly for those bulls, the index was already in a bit of trouble before they made their impact.
The long, significant uptrend channel from October 27 started to run into trouble in mid-January. The ASX traded more or less exactly along the channel’s lower uptrend boundary from January 16-29 befor slipping out of it on January 30.

Now that lower bound lies some 200 points below current market pricing and it looks like a very big ask to get the index back on that track anytime soon.
For now the index seems to have found support at 5835.4 on a daily-close basis. That’s the 61.8% Fibonacci retracement of the long climb from October 2017’s lows to the highs of early January. There appears to be some attempt to build a base in this region but the daily closes of the last couple of sessions simply don’t offer us much in the way of clues as to how successful this will be. The index has recovered a little and looks less oversold than it did but, again, momentum cues are not shouting anything obvious.
The uncommitted could be well advised to watch how the next couple of days’ trading plays out before getting involved. If current levels hold then the bulls have a platform on which to build as they try to offset this week’s dramatic falls. However, if they don’t then the entirety of the recent climb could come under threat. That would put focus on the mid-5600s at which support should at least be reasonably strong.
--- Written by David Cottle, DailyFX Research
Contact and follow David via Twitter on @DavidCottleFX or get in touch via the comments section below. We’d really love to hear from you.


