


Talking Points:
- The ASX 200 is stuck
- Its 2017 top remain unreachable but support not far below it has held the bears in check for months
- There’s little sign that that is about to change
Have a question about trading ASX 200? Join a Q&A webinar and ask it live!
Deadlock. That’s the word for ASX 200 price action right now. This phenomenon is not by any means confined to the benchmark Sydney equity index. You can see it in plenty of others, and also in currencies such as the Australian Dollar.
So what’s the deal? Well, the ASX is clearly below the two-year highs made back in May. But it remains at least relatively elevated compared to the last twelve months and support has been holding firm not far below the peak for quite some time.
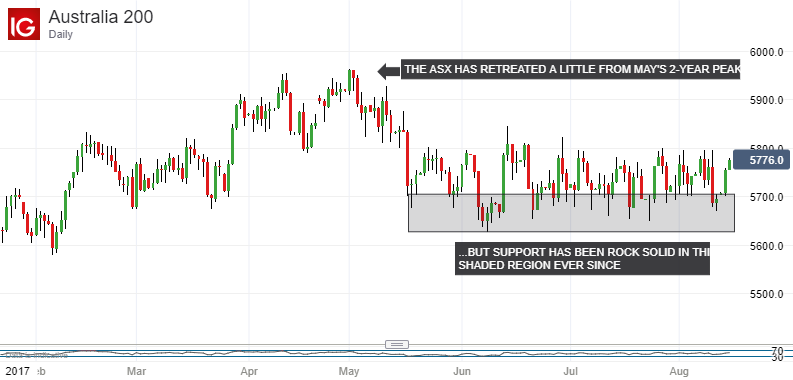
Is there any hope that the deadlock will break for the ASX anytime soon? Well, it has to be admitted, not much. The index has staged yet another bounce from that support area in the last couple of days but there’s little reason to suppose that it has the chops to break above current resistance in the 5800 area.
And, as we contemplate the index’s momentum, or lack thereof, here’s an interesting thing. The ASX’s Relative Strength Index makes rather compulsive viewing. So much so that it’s going to get a chart of its own:
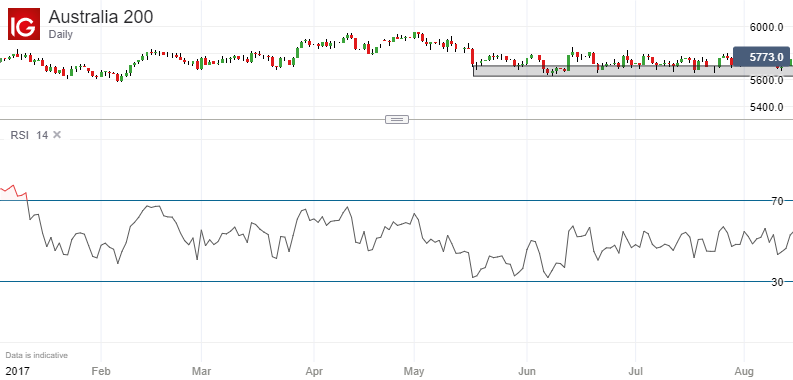
Here it is. It’s that wavy line you can see just below the candlestick chart of the ASX. What’s interesting, if not downright odd, is the way that the index has not been in either overbought or oversold territory this year at any point. It has spent precisely no time at all either above the 70 level that usually suggests buyers might have got ahead of themselves, nor yet below the 30 point, at which selling might have become too frenzied.
That’s rather a rare sight and suggests an index with sufficient momentum to sustain itself but not enough to change very far. That in turn makes another failure in the low 5800s all-too likely for the current uptick.
--- Written by David Cottle, DailyFX Research
Contact and follow David on Twitter: @DavidCottleFX


