


Talking Points:
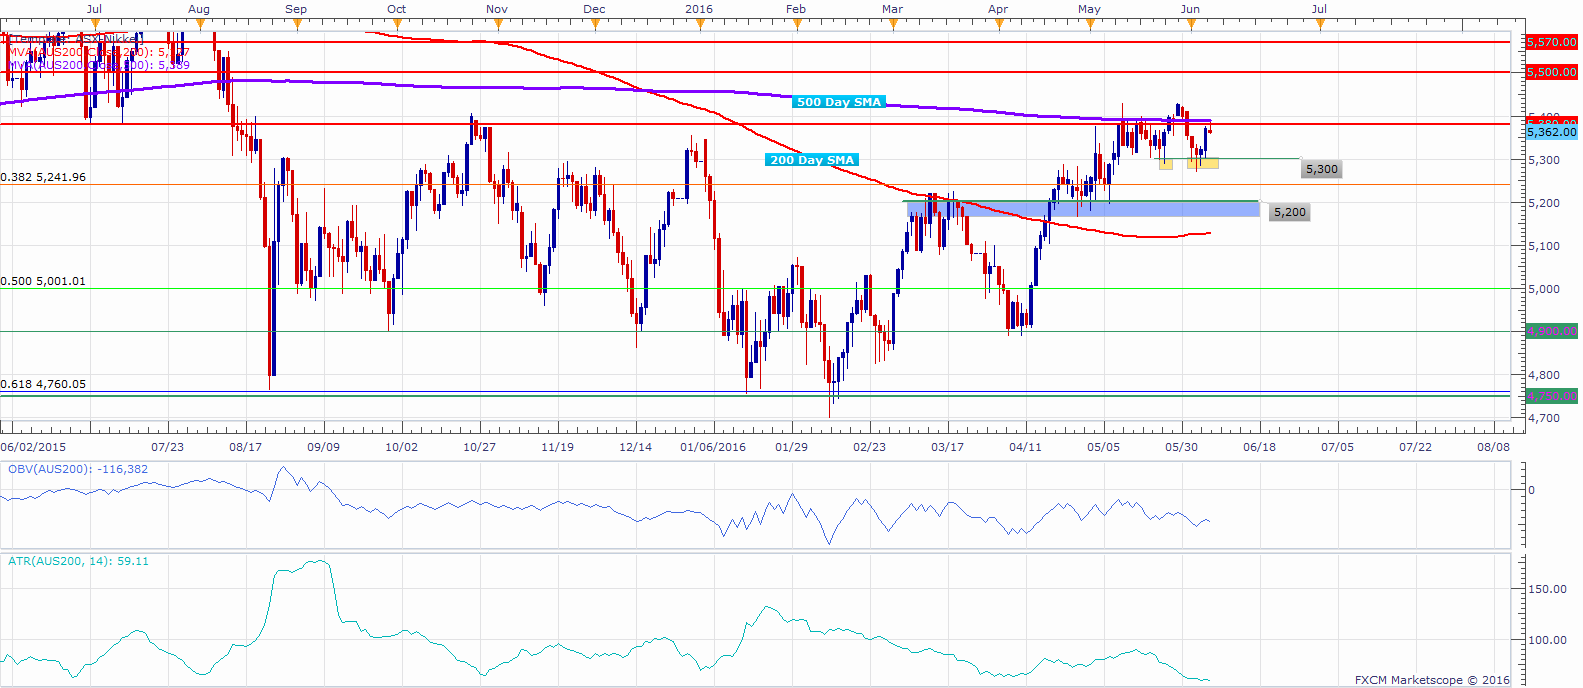
- Index held above short term support at 5,300 for another attempt at resistance
- The ASX 200 currently trades in proximity to 2016 highs and longer term range top
- Other correlated risk assets might require strong positive conviction for a break higher
The ASX 200 is trading near a long term range top resistance level at 5,380 (at the time this report was written) after the 5,300 support level held for what seems like another attempt for higher prices.
The Index has been trading for the past months in a well-defined range between the 5,380 resistance and the 4,750 support, which coincided with the 0.618 Fib level of the long term up trend from 2012.
The ASX failed to clear the range top on a number of occasions in the past weeks, but the hold above 5,300 appears to be supportive of higher prices, as it seems like the index is trying to carve out a “higher low”.
With that being said, the index may need other correlated risk assets such as the SPX 500, which currently trades near all-time highs, to find more positive conviction. Whether that’s the case remains to be seen however, and the ASX seems to face a confluence of resistance levels for a move higher.
A clear break and a hold above the 5,380 resistance, 2016 highs at 5,431, and the 500 day SMA might signal that the bulls have taken control, and that the long term up trend is resuming.
Another failed attempt at the top may initially expose the 5,300 level, followed by the 5,200 support zone from which it appears the last leg to the upside was initiated.
ASX 200 Daily Chart: June 7, 2016
--- Written by Oded Shimoni, DailyFX Research


