


Australian Dollar Outlook:
- AUD/JPY rates are rebounding at the base of a former symmetrical triangle, while AUD/USD rates are holding at channel support
- RBA rate hike odds have taken a hit after a deputy governor at the RBA warned that no hikes were coming in 2022.
- According to the IG Client Sentiment Index, AUD/USD has a bearish bias while AUD/JPY has a mixed outlook.

Still Dark Down Under
The Australian economy remains in a discouraging state, thanks to aggressive lockdown measures that have prevented an economic recovery from gathering pace. Data releases have been disappointing throughout November, with the Australia Citi Economic Surprise Index down from +74.9 at the start of the month to +30.1 today.
Accordingly, RBA policymakers have warned that rate hikes won't be arriving soon. Earlier this week, RBA Governor Philip Lowe said that “the economy and inflation would have to turn out very differently from our central scenario for the board to consider an increase in interest rates next year.”
As rates markets have pulled back their RBA rate hike timing, the Australian Dollar has suffered. Alongside weaker commodity prices, a reduction in RBA rate hike odds has seen the major AUD-crosses, AUD/JPY and AUD/USD rates, drop into technical support regions in recent days.
AUD/USD RATE TECHNICAL ANALYSIS: DAILY CHART (November 2020 to November 2021) (CHART 1)

Losses have racked up this week for AUD/USD, which fell to its lowest level since the start of October. The pair is working on a doji candle today, having hit a fresh monthly low before rebounding at the rising uptrend from the August and September swing lows, support in what could be a bear flag that’s been forming since the end of July.
Given the current momentum profile, it’s possible that AUD/USD rates breakdown further out of their bear flag. The pair is below its daily 5-, 8-, 13-, and 21-EMA envelope, which is in bearish sequential order. Daily MACD is declining below its signal line, while daily Slow Stochastics are holding in oversold territory. A move below 0.7245 would suggest that the bear flag bearish breakout has begun, eyeing a return to the yearly low at 0.7106.
IG Client Sentiment Index: AUD/USD RATE Forecast (November 18, 2021) (Chart 2)
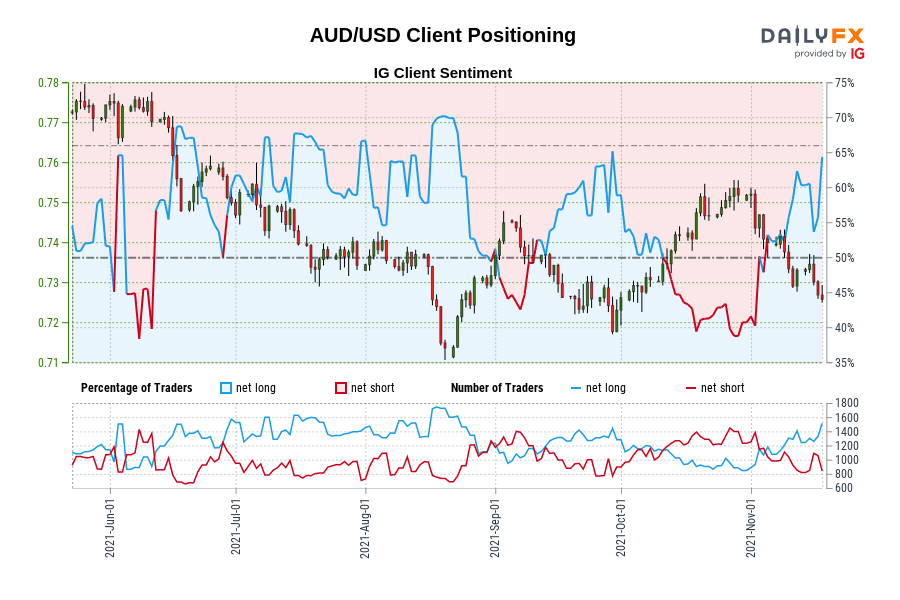
AUD/USD: Retail trader data shows 64.74% of traders are net-long with the ratio of traders long to short at 1.84 to 1. The number of traders net-long is 6.07% higher than yesterday and 14.66% higher from last week, while the number of traders net-short is 5.10% lower than yesterday and 4.04% lower from last week.
We typically take a contrarian view to crowd sentiment, and the fact traders are net-long suggests AUD/USD prices may continue to fall.
Traders are further net-long than yesterday and last week, and the combination of current sentiment and recent changes gives us a stronger AUD/USD-bearish contrarian trading bias.
AUD/JPY RATE TECHNICAL ANALYSIS: DAILY CHART (November 2020 to November 2021) (CHART 3)
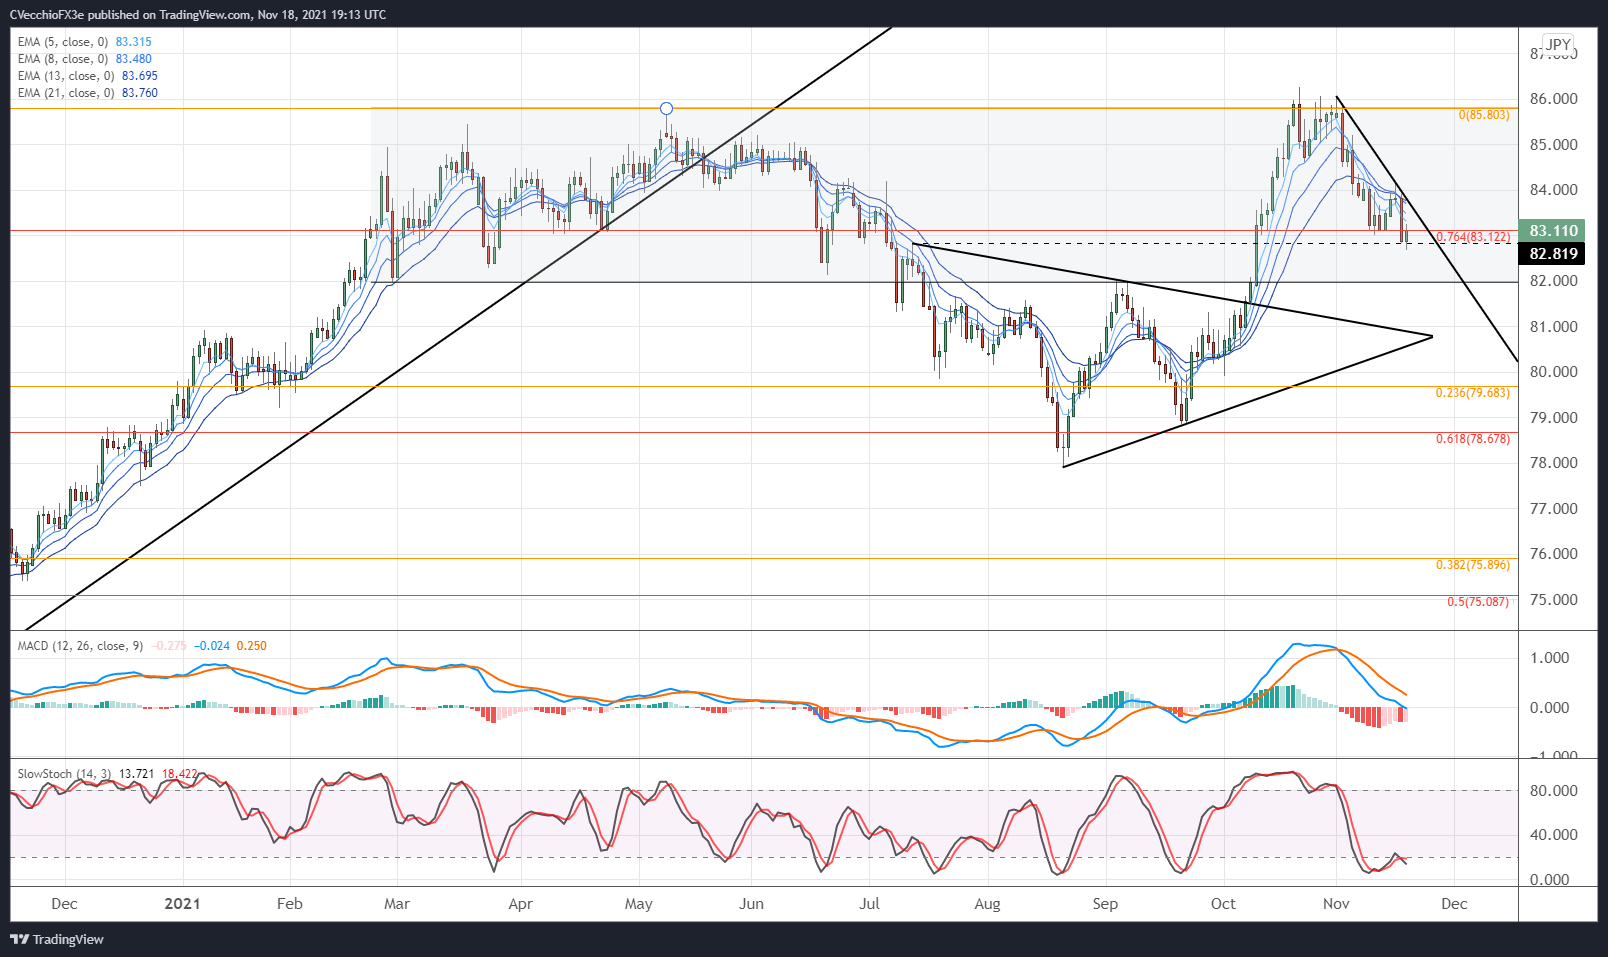
The breakout by AUD/JPY rates to fresh yearly highs in October was quickly reversed, and the pair has been mired in a sharp downtrend since the beginning of November (the monthly high was established on the first trading day of the month. The pair is finding support today near a confluence zone of two technical levels, the 76.4% Fibonacci retracement of the 2017 high/2020 low range at 83.12 and at the mid-July swing high, the base of the symmetrical triangle that formed between mid-July and early-October, at 82.82.
Selling rallies may be the preferred directional bias in the near-term as momentum metrics remain bearish. AUD/JPY rates are below their daily EMA envelope, which remains in bearish sequential order. Daily MACD has just begun to decline through its signal line, while daily Slow Stochastics remain in oversold territory. Unless AUD/JPY rates recover through their daily 21-EMA (83.76 today), the most likely outcome appears to be for a continued drop towards 82.00 in the near-term.
IG Client Sentiment Index: AUD/JPY Rate Forecast (November 18, 2021) (Chart 4)

AUD/JPY: Retail trader data shows 35.81% of traders are net-long with the ratio of traders short to long at 1.79 to 1. The number of traders net-long is 6.32% lower than yesterday and 4.71% higher from last week, while the number of traders net-short is 3.33% lower than yesterday and 3.92% lower from last week.
We typically take a contrarian view to crowd sentiment, and the fact traders are net-short suggests AUD/JPY prices may continue to rise.
Positioning is more net-short than yesterday but less net-short from last week. The combination of current sentiment and recent changes gives us a further mixed AUD/JPY trading bias.
Read more: Central Bank Watch: BOC, RBA, & RBNZ Interest Rate Expectations Update
--- Written by Christopher Vecchio, CFA, Senior Strategist


