


Australian Dollar, AUD/USD, AUD/JPY, AUD/NZD, IGCS – Talking Points:
- AUD/USD consolidating above key supportive shelf.
- AUD/JPY inverse Head and Shoulders pattern playing out.
- AUD/NZD Double Top reversal still in play.
As predicted in previous reports, the Australian Dollar has slipped lower against the haven-associated Japanese Yen and US Dollar in recent weeks, while climbing higher against its New Zealand counterparts, as risk appetite across global markets notably faded.
However, these dynamics may prove short-lived and eventually give way to the primary trends established back in March of 2020. Key levels to watch for AUD/USD, AUD/JPY and AUD/NZD rates.
AUD/USD Weekly Chart – Consolidating Above Key Supportive Shelf
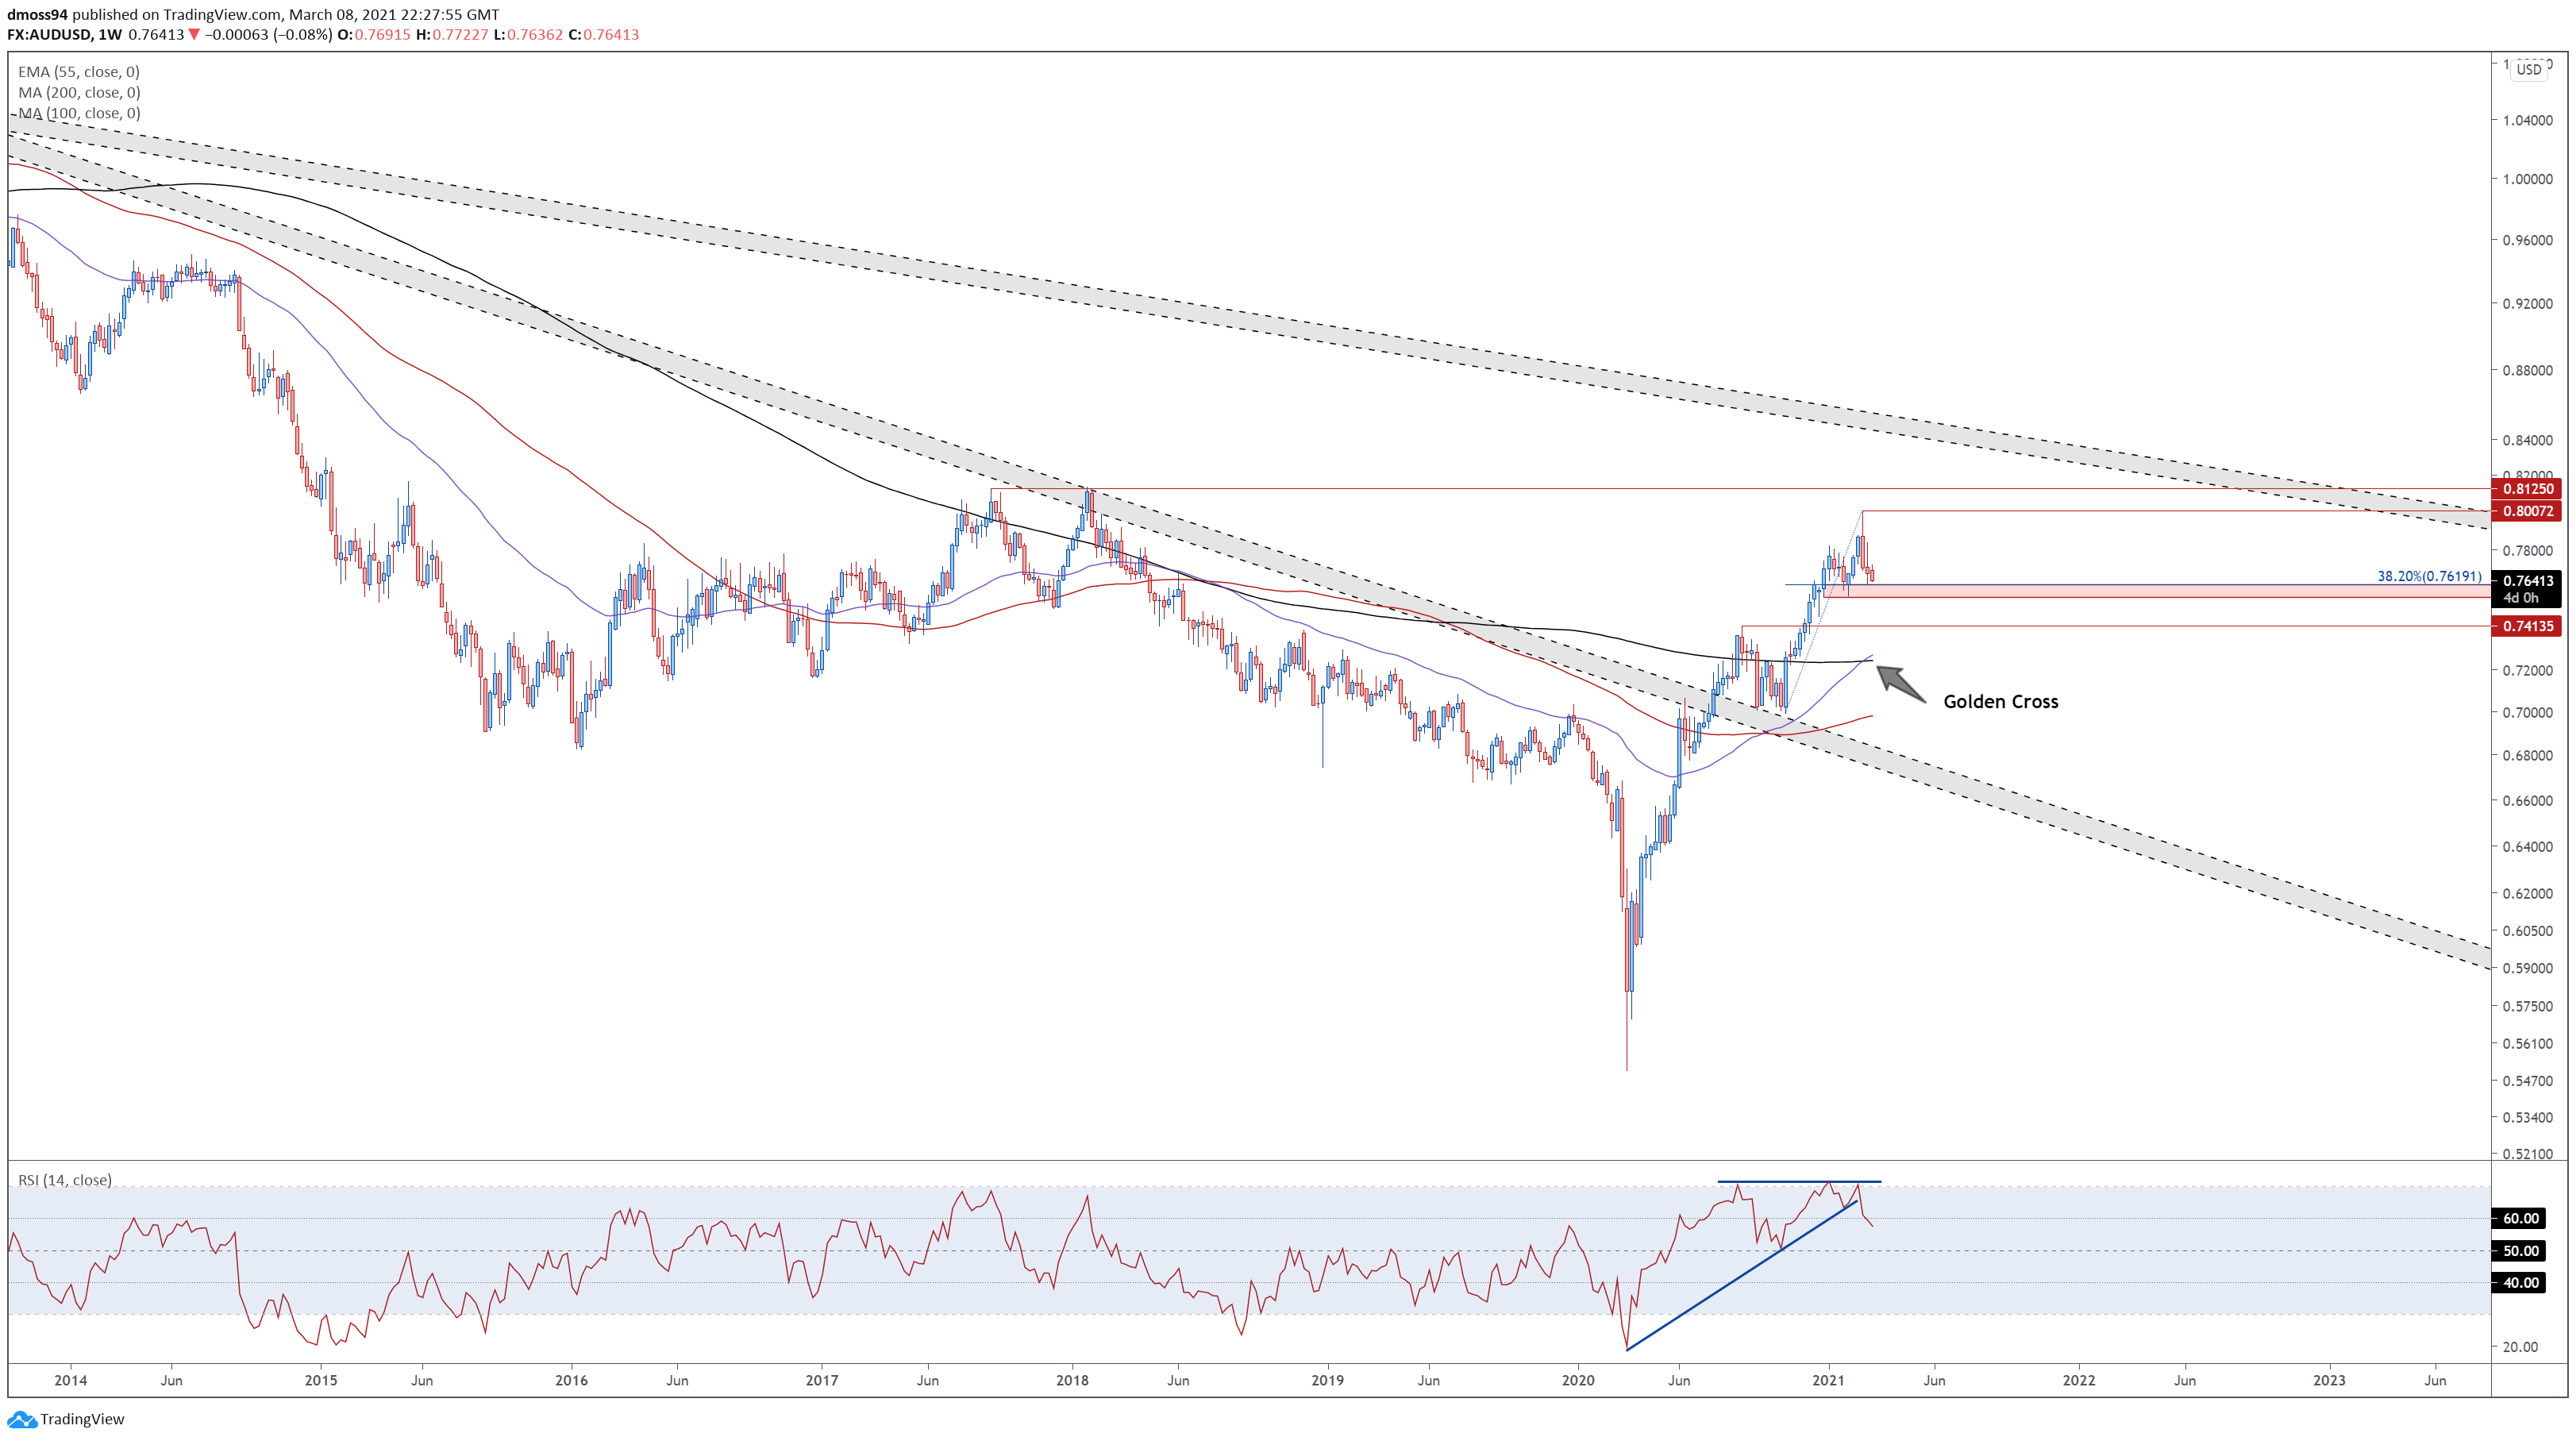
AUD/USD weekly chart created using Tradingview
The AUD/USD exchange rate looks set to register three successive down-weeks for the first time since March of last year, as prices tumble as much as 4.8% lower from multi-year highs set at the tail-end of February.
However, this move lower appears to be nothing more than a counter-trend correction, given price remains constructively perched above key range support at 0.7560 – 0.7620 and the 38.2% Fibonacci retracement (0.7619) of the uptrend extending from the December 2020 low to the yearly high.
Indeed, with the RSI continuing to track above its neutral midpoint, and a bullish Golden Cross formation taking shape between the 200-MA and 55-EMA, the path of least resistance seems higher.
With that in mind, AUD/USD could be poised to reverse higher in the coming weeks if range support at 0.7560 – 0.7620 remains intact. If not, a more extended pullback towards the August 2020 high (0.7413) could be on the cards.
AUD/USD Daily Chart – Andrews’ Pitchfork Implies Uptrend Still Intact
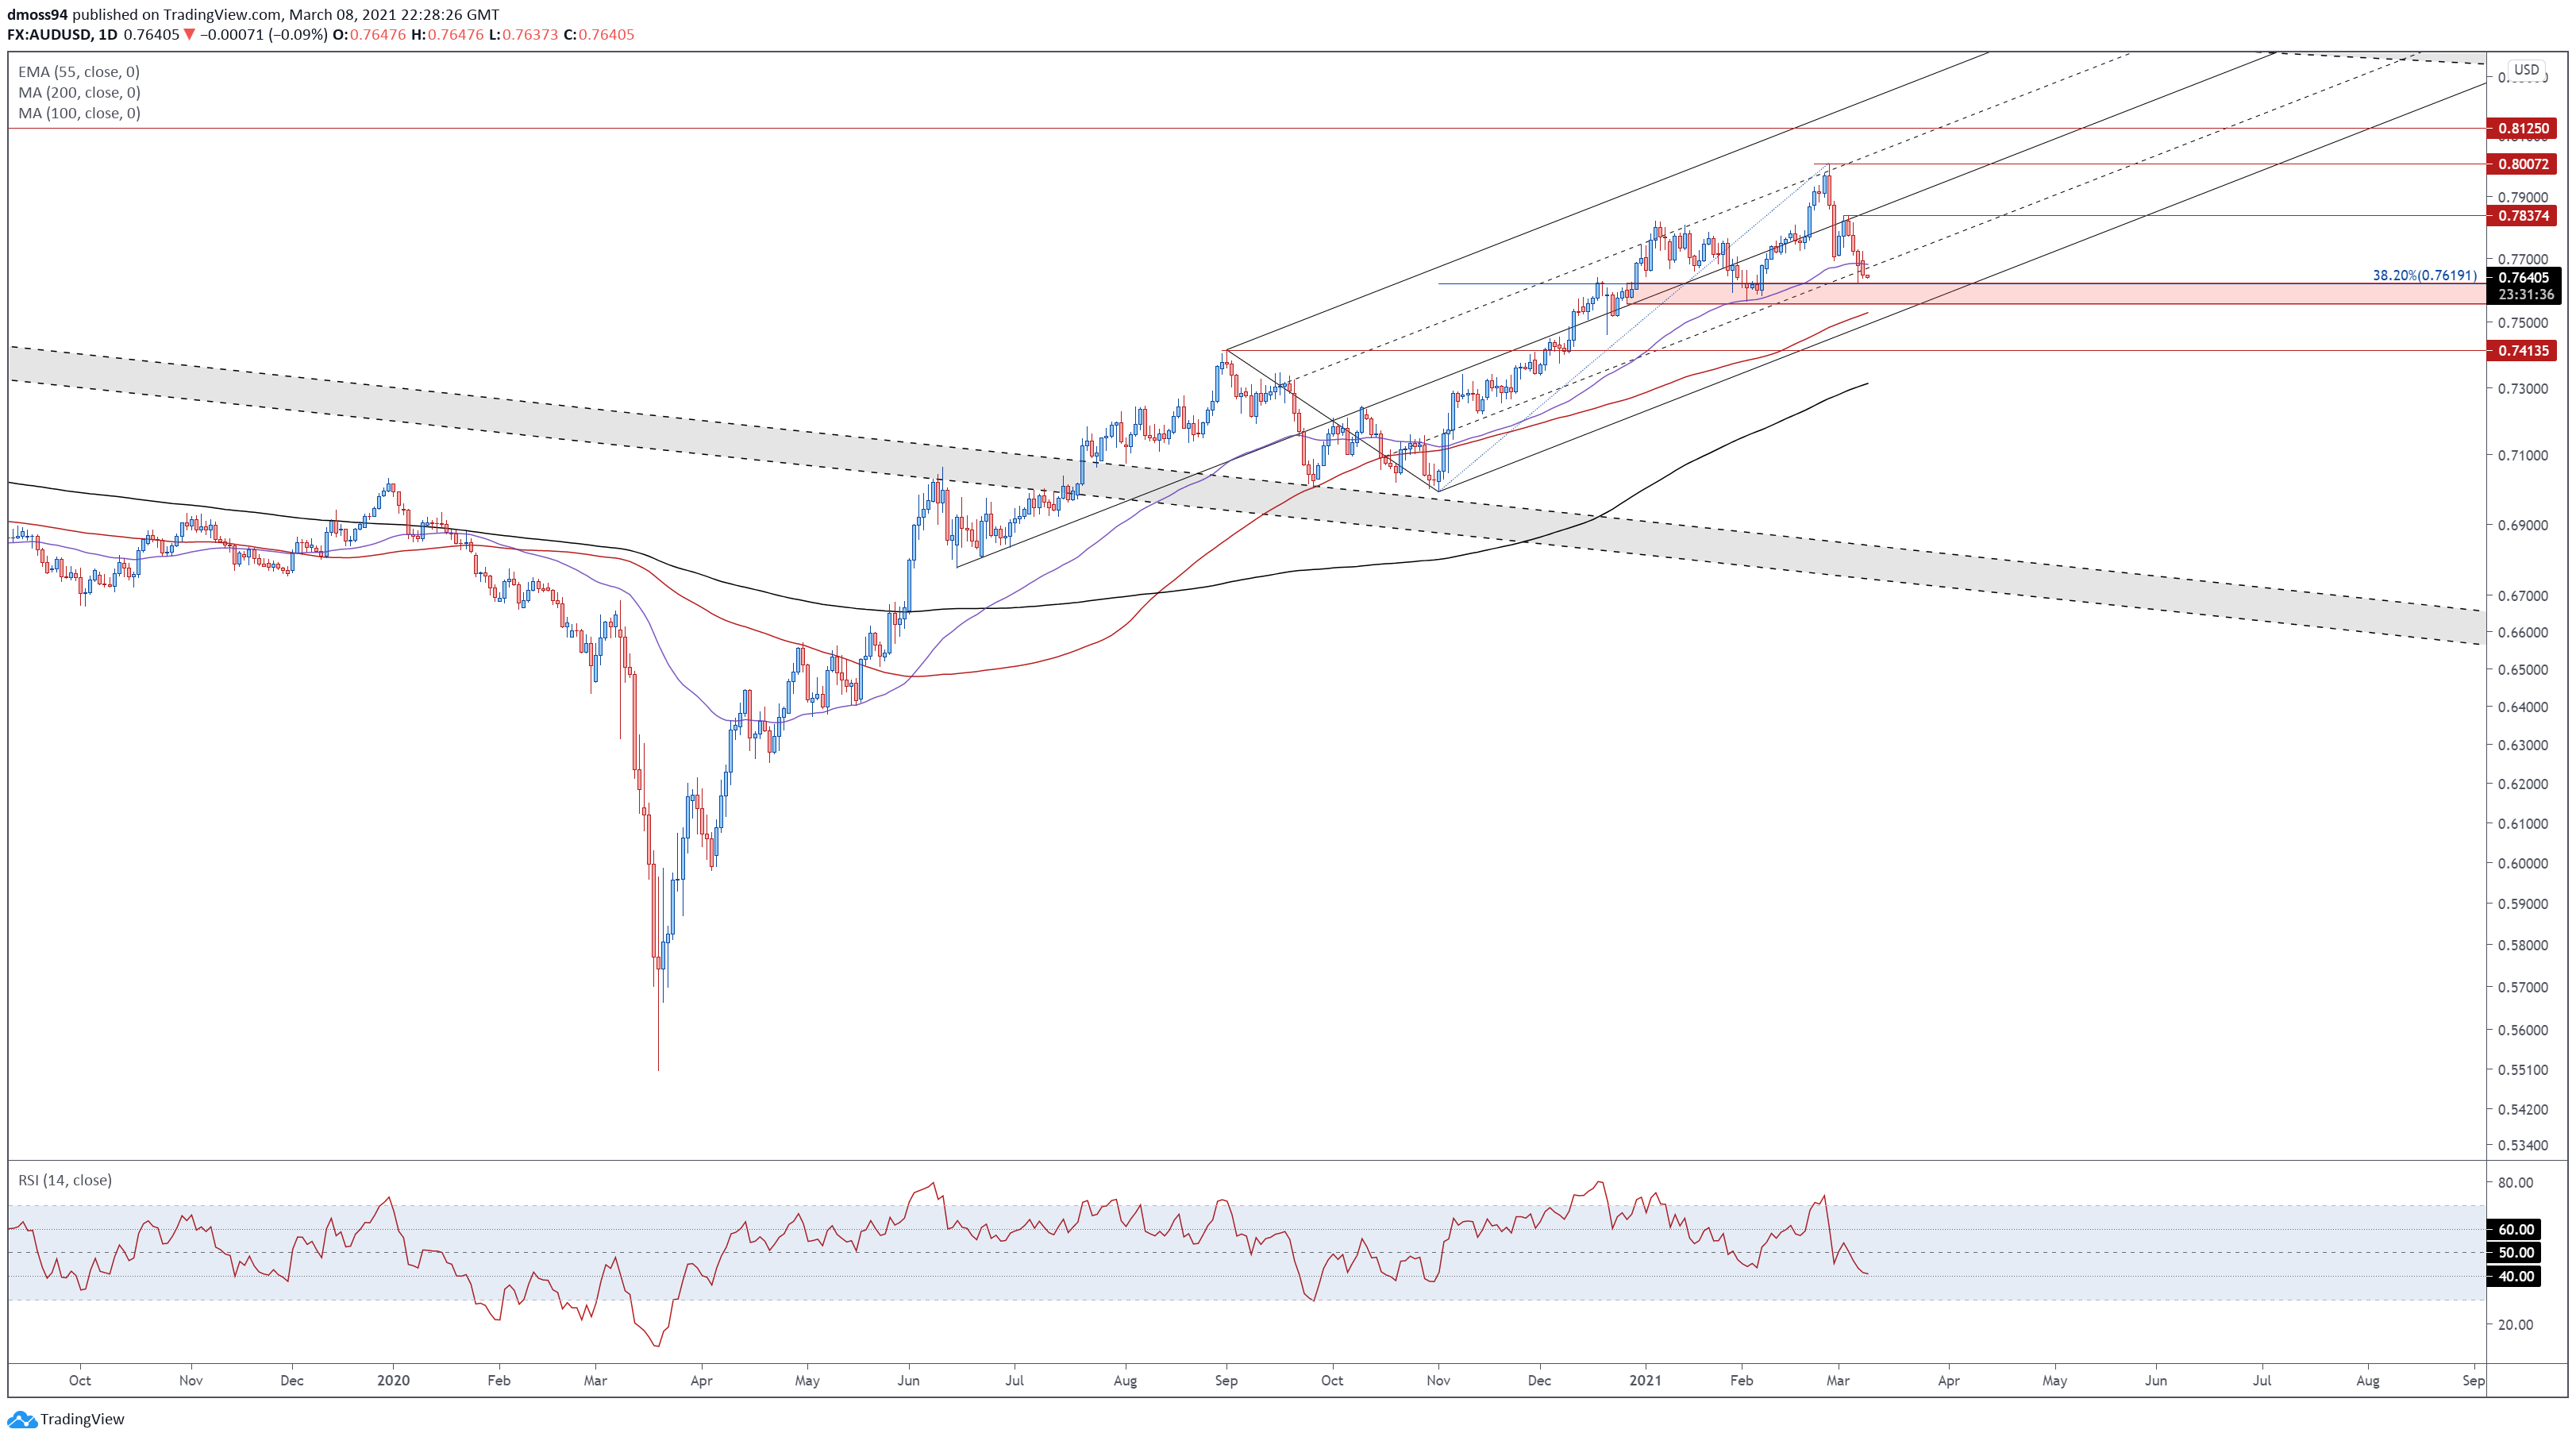
AUD/USD daily chart created using Tradingview
Zooming into the daily chart reinforces the long-term bullish outlook depicted on the weekly timeframe, as price continues to track within the confines of an ascending Andrews’ Pitchfork and firmly above both the 100- and 200-day moving averages.
That being said, a short-term pullback to confluent support at the pitchfork parallel and February low (0.7564) looks likely, given price has dipped back below the trend-defining 55-EMA (0.7681) for the first time since October 2020.
This could ultimately lead to a resumption of the primary uptrend, with a daily close back above 0.7700 probably igniting a push to retest the monthly high (0.7837).
On the contrary, a daily close below 0.7560 may intensify selling pressure and carve a path of the exchange rate to challenge the sentiment-defining 200-MA (0.7312).
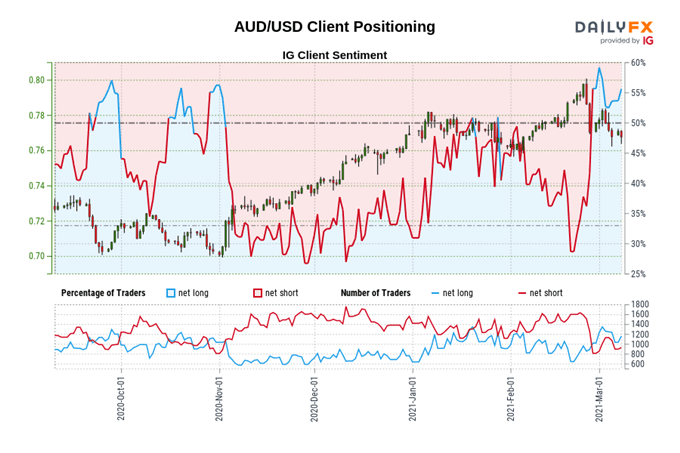
The IG Client Sentiment Report shows 50.93% of traders are net-long with the ratio of traders long to short at 1.04 to 1. The number of traders net-long is 10.95% higher than yesterday and 9.41% lower from last week, while the number of traders net-short is 23.52% higher than yesterday and 12.44% higher from last week.
We typically take a contrarian view to crowd sentiment, and the fact traders are net-long suggests AUD/USD prices may continue to fall.
Yet traders are less net-long than yesterday and compared with last week. Recent changes in sentiment warn that the current AUD/USD price trend may soon reverse higher despite the fact traders remain net-long.
AUD/JPY Weekly Chart – Inverse Head and Shoulders Implies Extended Gains
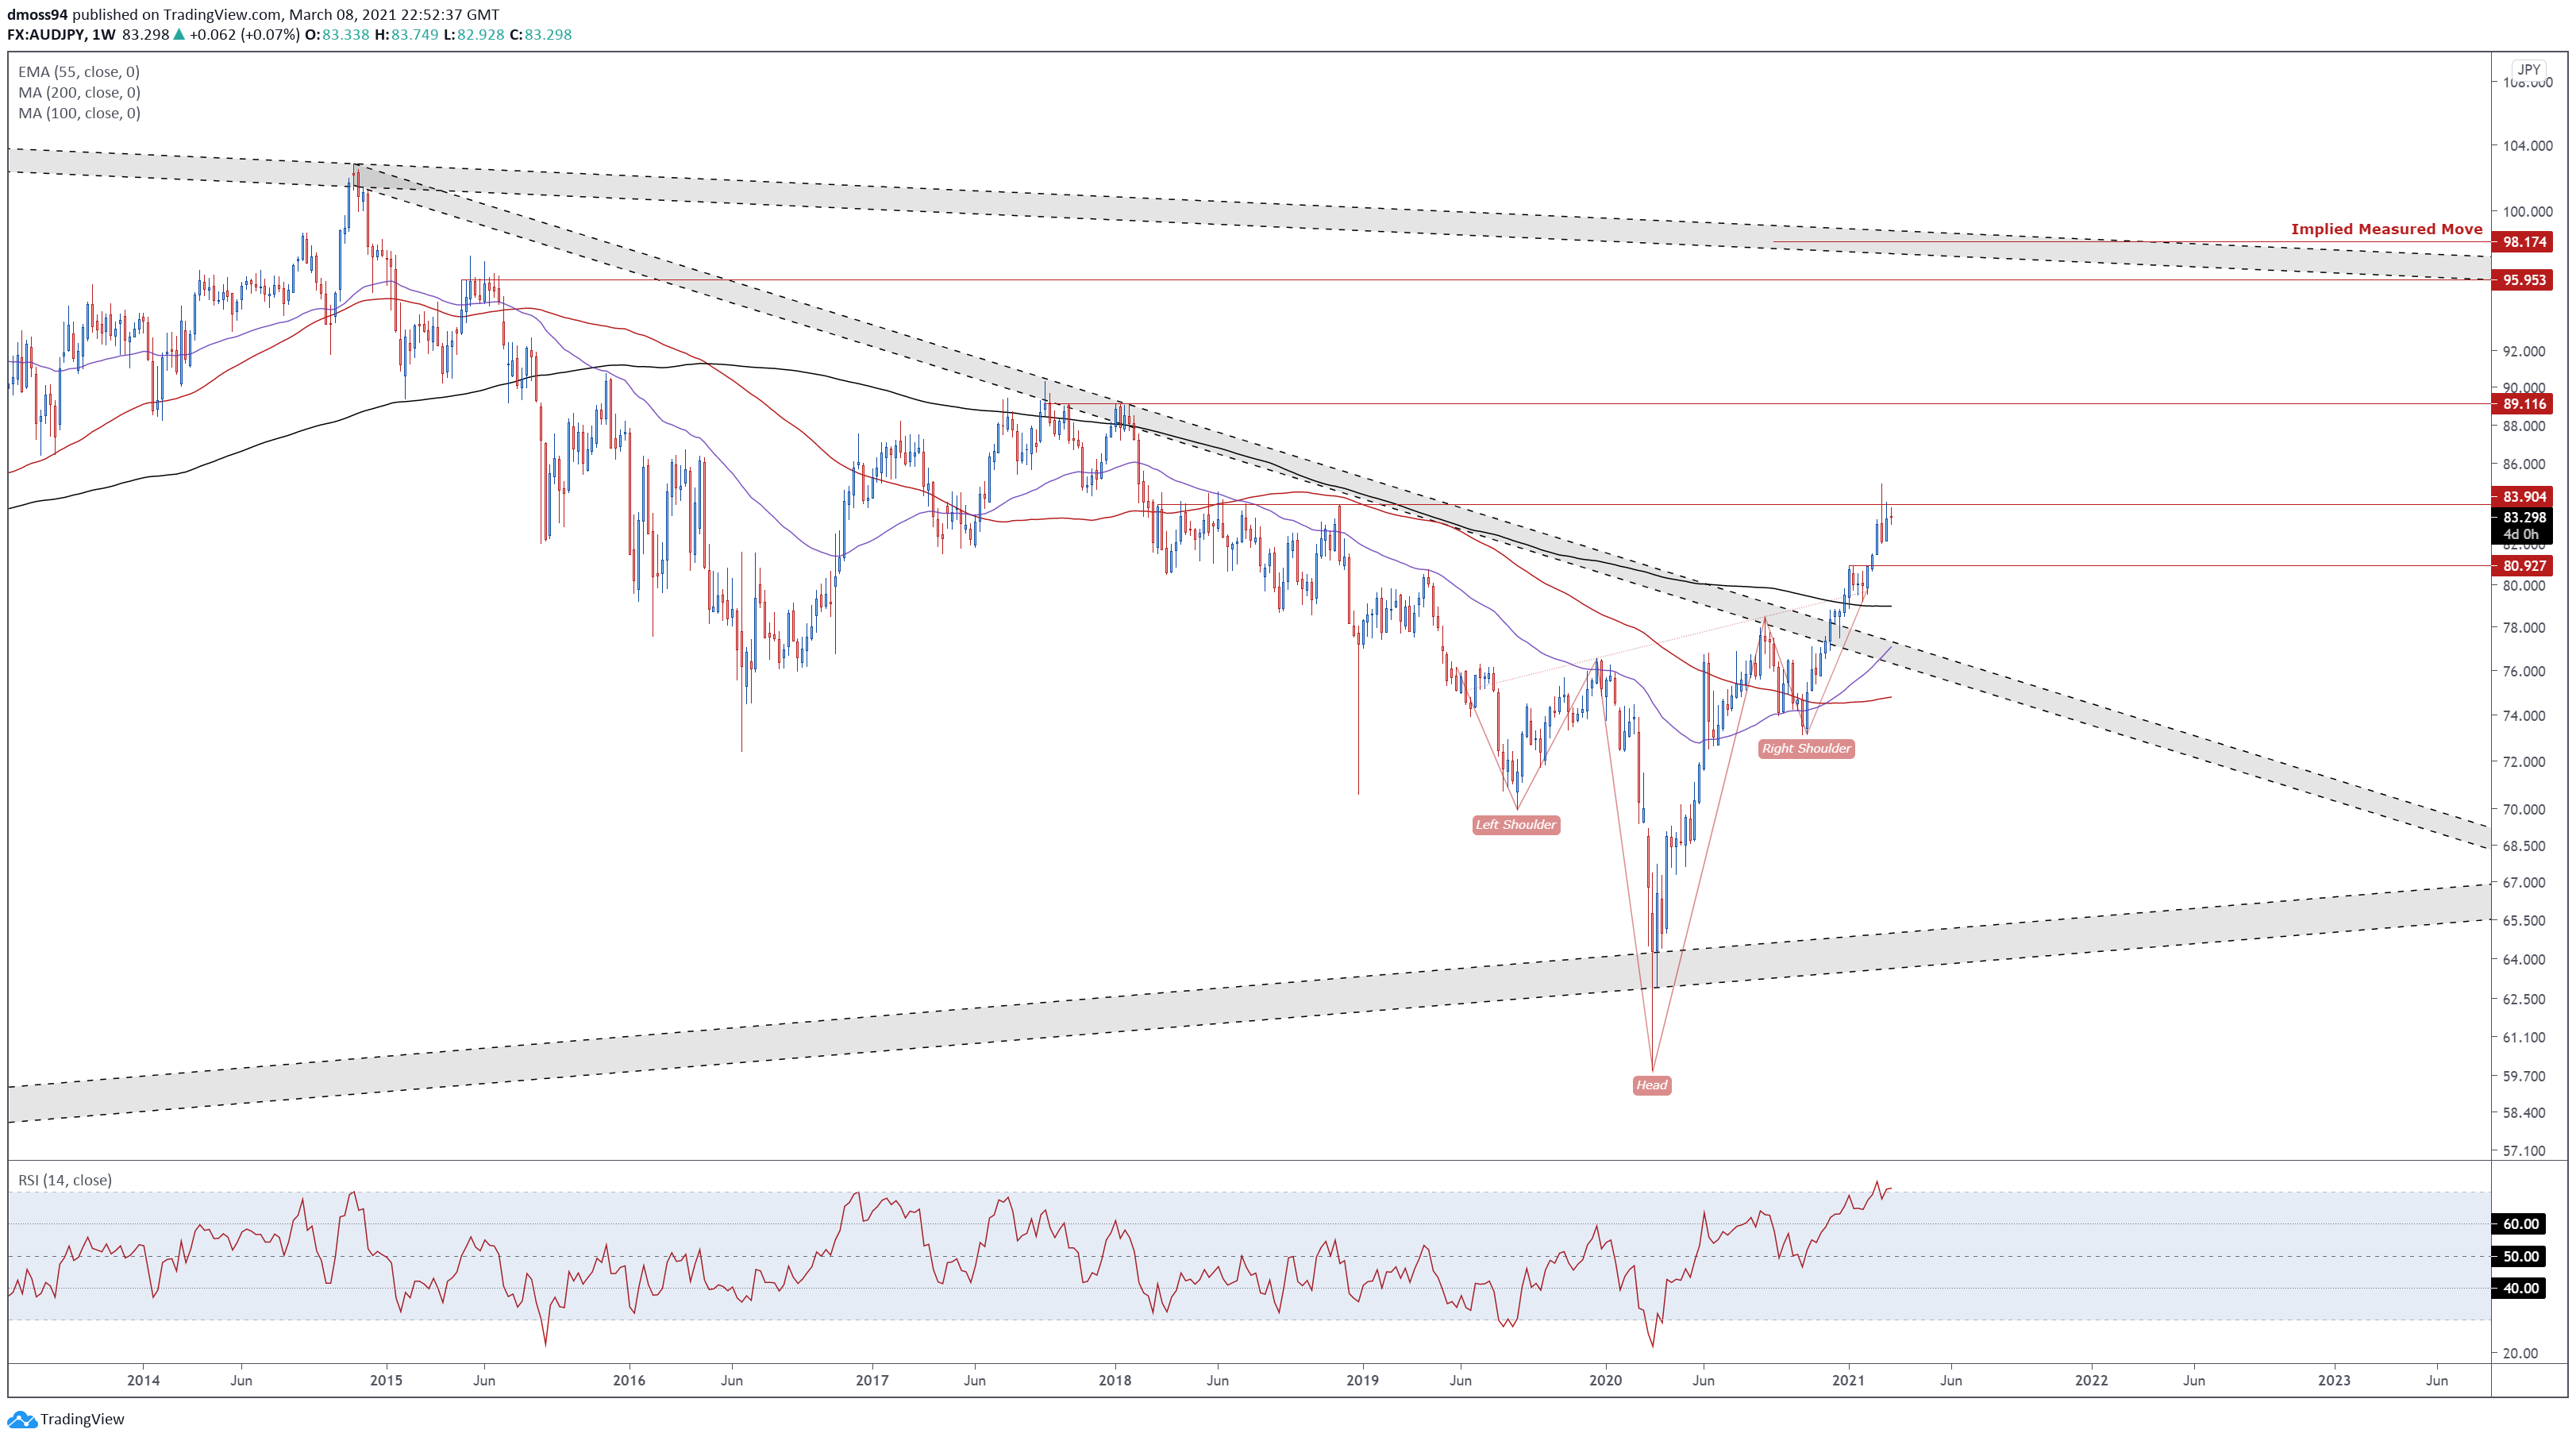
AUD/JPY weekly chart created using Tradingview
Bearish RSI divergence, in tandem with AUD/JPY’s failure to gain a firm foothold above 84.00, implies that the exchange rate’s 41.9% surge from the March 2020 nadir may be running out of steam.
However, with price validating the break of an inverse Head & Shoulders reversal pattern, and slicing through the sentiment-defining 200-MA (78.98) for the first time since 2018, the path of least resistance remains skewed to the topside.
Nevertheless, the absence of a weekly close above psychological resistance at 84.00 could result in a short-term pullback towards the monthly low (82.09). Ultimately, a convincing break above 84.00 is needed to bring the 2017 high (90.31) into focus.
AUD/JPY Daily Chart – Bull Flag in Play
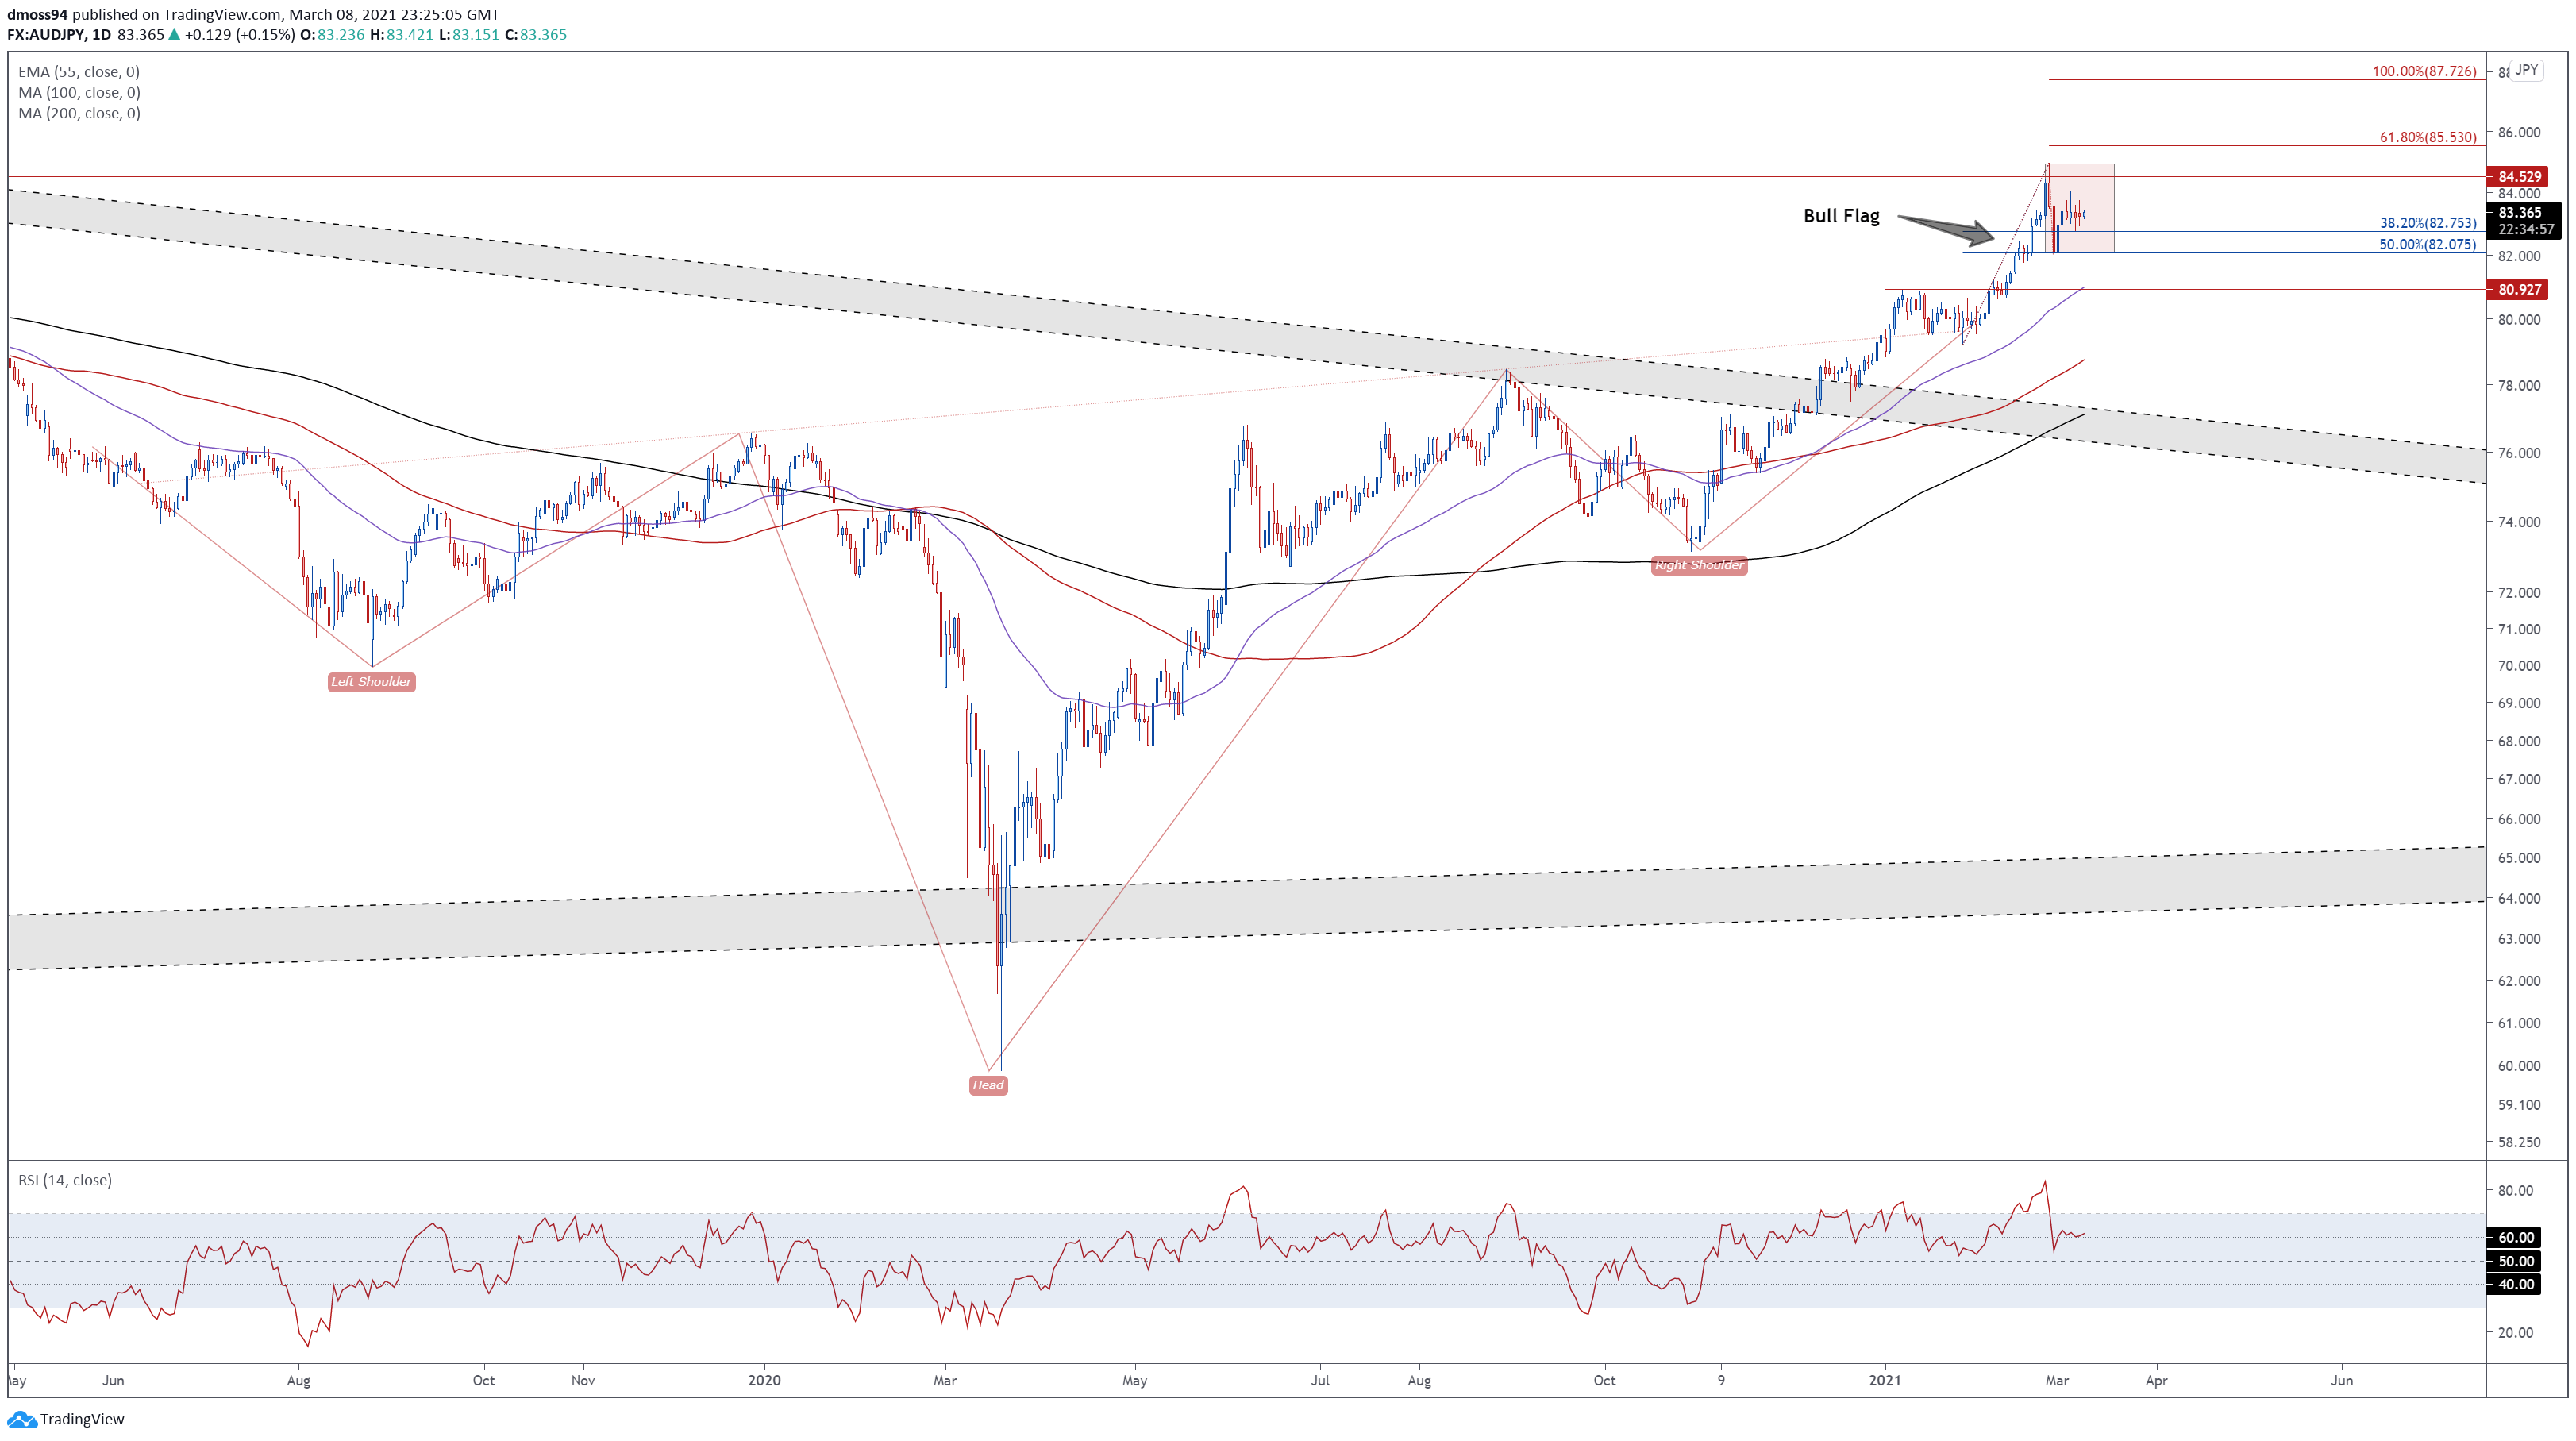
AUD/JPY daily chart created using Tradingview
A Bull Flag formation on the daily timeframe hints at an impending topside surge, as price consolidates above the 50% Fibonacci retracement (82.07) of the uptrend extending from the January 28 low to the yearly high.
With price tracking firmly above all three moving averages, and the RSI hovering above 60 and eyeing a push into overbought territory, further gains looks likely in the near term.
A daily close above the February high (84.95) is required to validate the bullish continuation pattern and pave the way for buyers to challenge the 100% Fibonacci (87.73).
The pattern’s implied measured move suggesting that price may climb an additional 8% from current levels to challenge psychological resistance at 90.00.
However, collapsing below the 50% Fibonacci would invalidate the Bull Flag pattern and probably result in a pullback to the trend-defining 55-EMA (80.99).
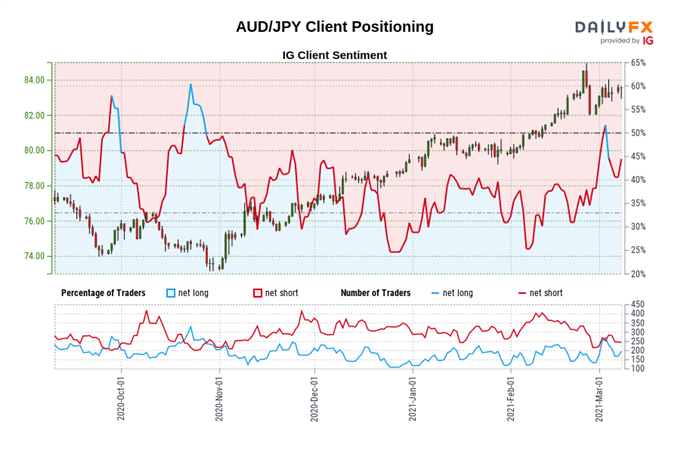
The IG Client Sentiment Report shows 41.59% of traders are net-long with the ratio of traders short to long at 1.40 to 1. The number of traders net-long is 12.57% higher than yesterday and 18.97% lower from last week, while the number of traders net-short is 7.76% higher than yesterday and 6.88% higher from last week.
We typically take a contrarian view to crowd sentiment, and the fact traders are net-short suggests AUD/JPY prices may continue to rise.
Positioning is less net-short than yesterday but more net-short from last week. The combination of current sentiment and recent changes gives us a further mixed AUD/JPY trading bias.
AUD/NZD Daily Chart – Double Top in Focus

AUD/NZD daily chart created using Tradingview
Finally, AUD/NZD rates may be at risk of earing recent gains, as price carves out a Double Top pattern just below key resistance at 1.0800.
However, with the RSI jumping back above its neutral midpoint, and price perched constructively above all three moving averages, a push to retest the February high (1.0828) could be in the offing.
Clearing that would invalidate the bearish pattern and open the door for buyers to drive the exchange rate back towards the 2020 high (1.1044).
On the other hand, diving back below 1.0700 likely intensifies near-term selling pressure and results in a challenge of the monthly low (1.0644). Hurdling that brings the Double Top neckline (1.0541) into the crosshairs.
-- Written by Daniel Moss, Analyst for DailyFX
Follow me on Twitter @DanielGMoss


