


Australian Dollar, AUD/USD, AUD/JPY, Technical Analysis, IGCS – Talking Points:
- The cyclically-sensitive Australian Dollar’s recent slide lower may prove to be nothing more than a short-term pullback.
- AUD/JPY, AUD/USD rates eyeing a push back towards yearly highs as both exchange rates carve out a bullish Falling Wedge pattern.
The cyclically-sensitive Australian Dollar has come under pressure in recent days, as low trading volumes and souring risk appetite pushed the currency lower against its haven-associated counterparts. However, this downside push may prove to be nothing more than a short-term pullback. Here are the key levels to watch for AUD/USD and AUD/JPY rates.
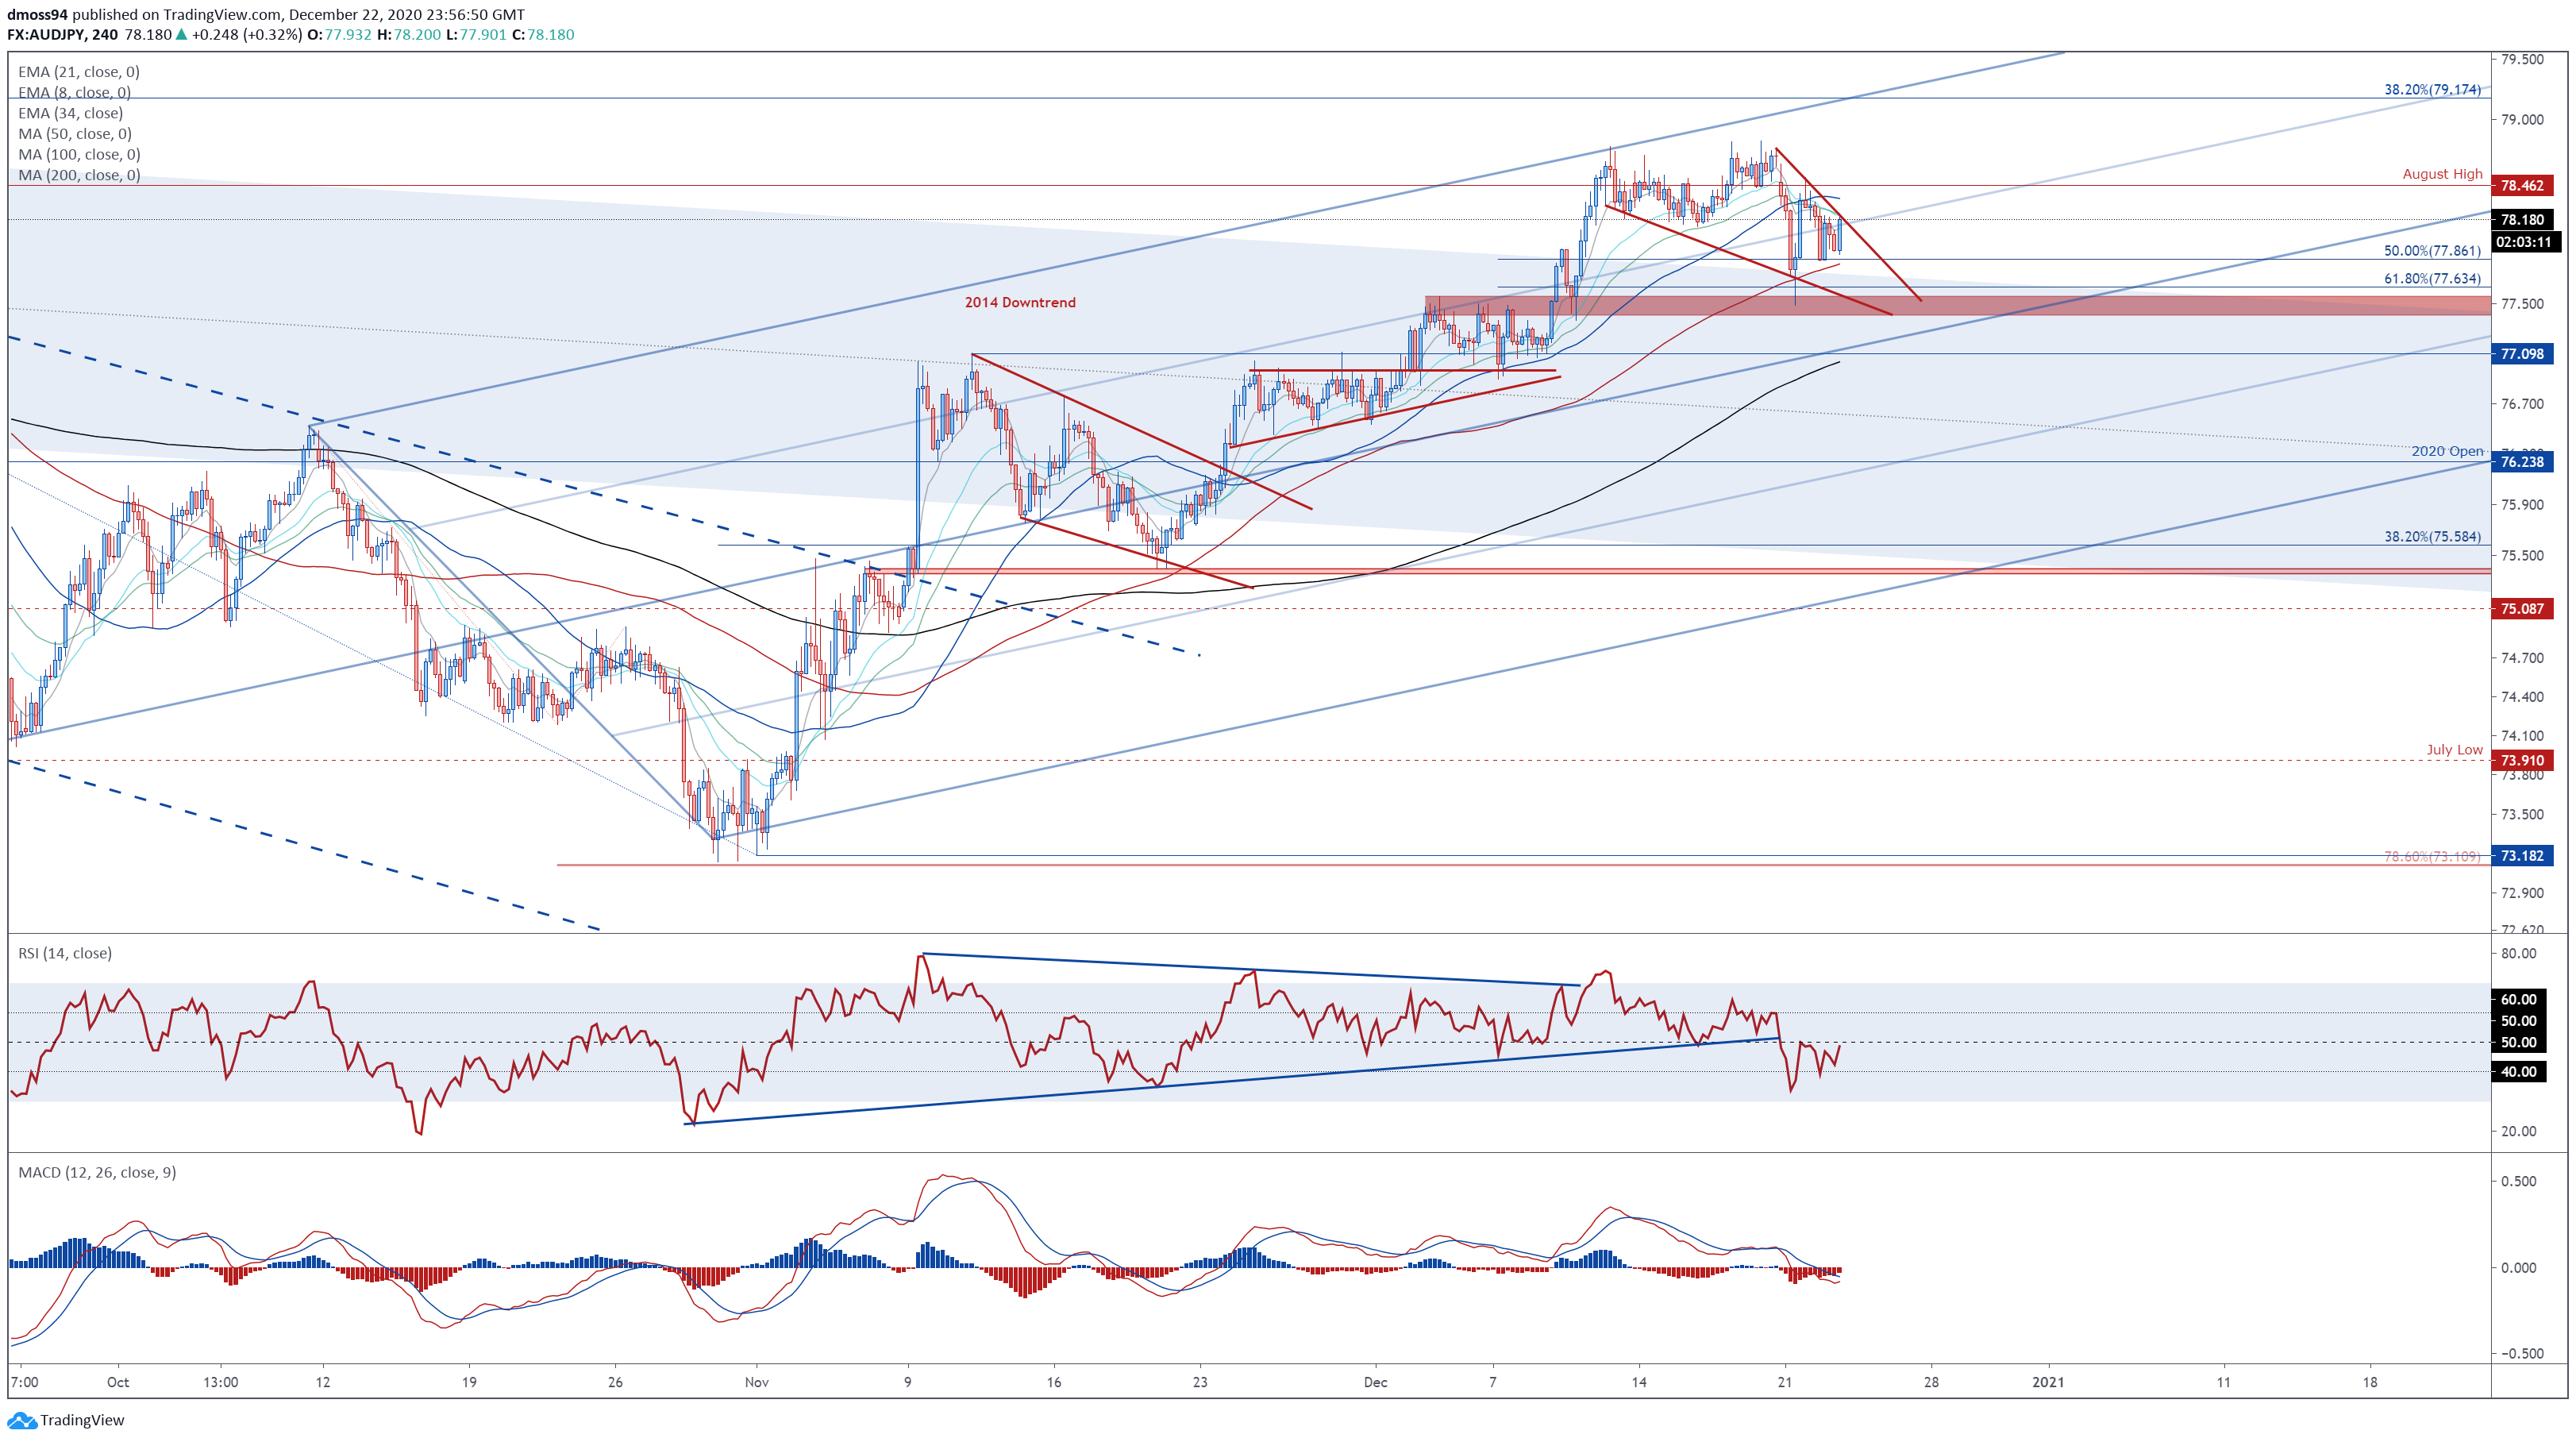
AUD/JPY Daily Chart – Holding Firmly Above 2014 Downtrend

AUD/JPY daily chart created using Tradingview
AUD/JPY rates have slipped just over 1% lower in recent days, after sliding back below support at the August high (78.46).
However, this may prove to be nothing more than a short-term pullback, given price remains constructively perched above former resistance-turned-support at the 2014 downtrend and the 21-day moving average (77.65).
Moreover, with the RSI and MACD indicator tracking firmly above their respective neutral midpoints, and the slopes of the 50-DMA, 100-DMA and 200-DMA notably steepening, the path of least resistance remains skewed to the topside.
With that in mind, prices may push higher in the near term, if support at the December 3 high (77.56) holds firm, with a daily close back above the 8-EMA (78.13) probably opening the door to a retest of the yearly high (78.83).
Clearing that is required to signal the resumption of the primary uptrend and bring the 2019 high (80.72) into focus.
Alternatively, sliding below 77.50 could generate a more extensive correction back towards the trend-defining 50-DMA (76.22).
AUD/JPY 4-Hour Chart – Falling Wedge Hints at Topside Breakout
AUD/JPY 4-hour chart created using Tradingview
Zooming into a four-hour chart bolsters the bullish outlook depicted on the daily timeframe, as AUD/JPY gyrates within the confines of a bullish Falling Wedge pattern.
Ultimately, a convincing break of wedge resistance and the 21-MA (78.21) is needed to validate the bullish pattern and carve a path for prices to begin probing the yearly high (78.83).
On the other hand, breaching range support at 77.40 – 77.50 would probably invalidate the Falling Wedge pattern and generate a push to test psychological support at 77.00.
| Change in | Longs | Shorts | OI |
| Daily | 0% | 11% | 5% |
| Weekly | 29% | -25% | -3% |
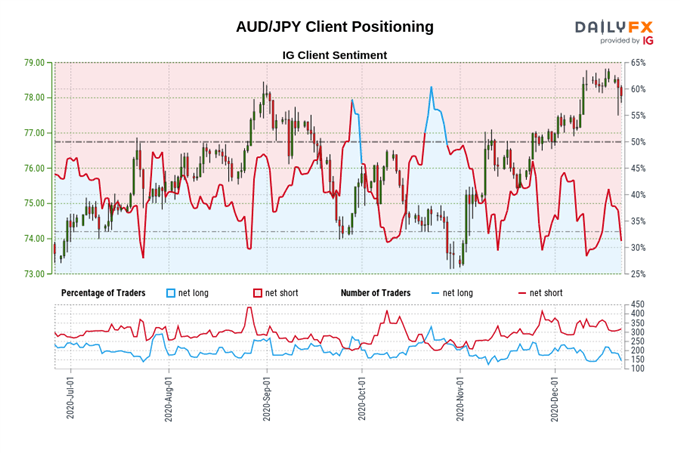
The IG Client Sentiment Report shows 31.81% of traders are net-long with the ratio of traders short to long at 2.14 to 1. The number of traders net-long is 20.47% higher than yesterday and 9.47% lower from last week, while the number of traders net-short is 3.80% higher than yesterday and 8.64% lower from last week.
We typically take a contrarian view to crowd sentiment, and the fact traders are net-short suggests AUD/JPY prices may continue to rise.
Positioning is less net-short than yesterday but more net-short from last week. The combination of current sentiment and recent changes gives us a further mixed AUD/JPY trading bias.
AUD/USD Daily Chart – Ascending Pitchfork Guiding Price Higher
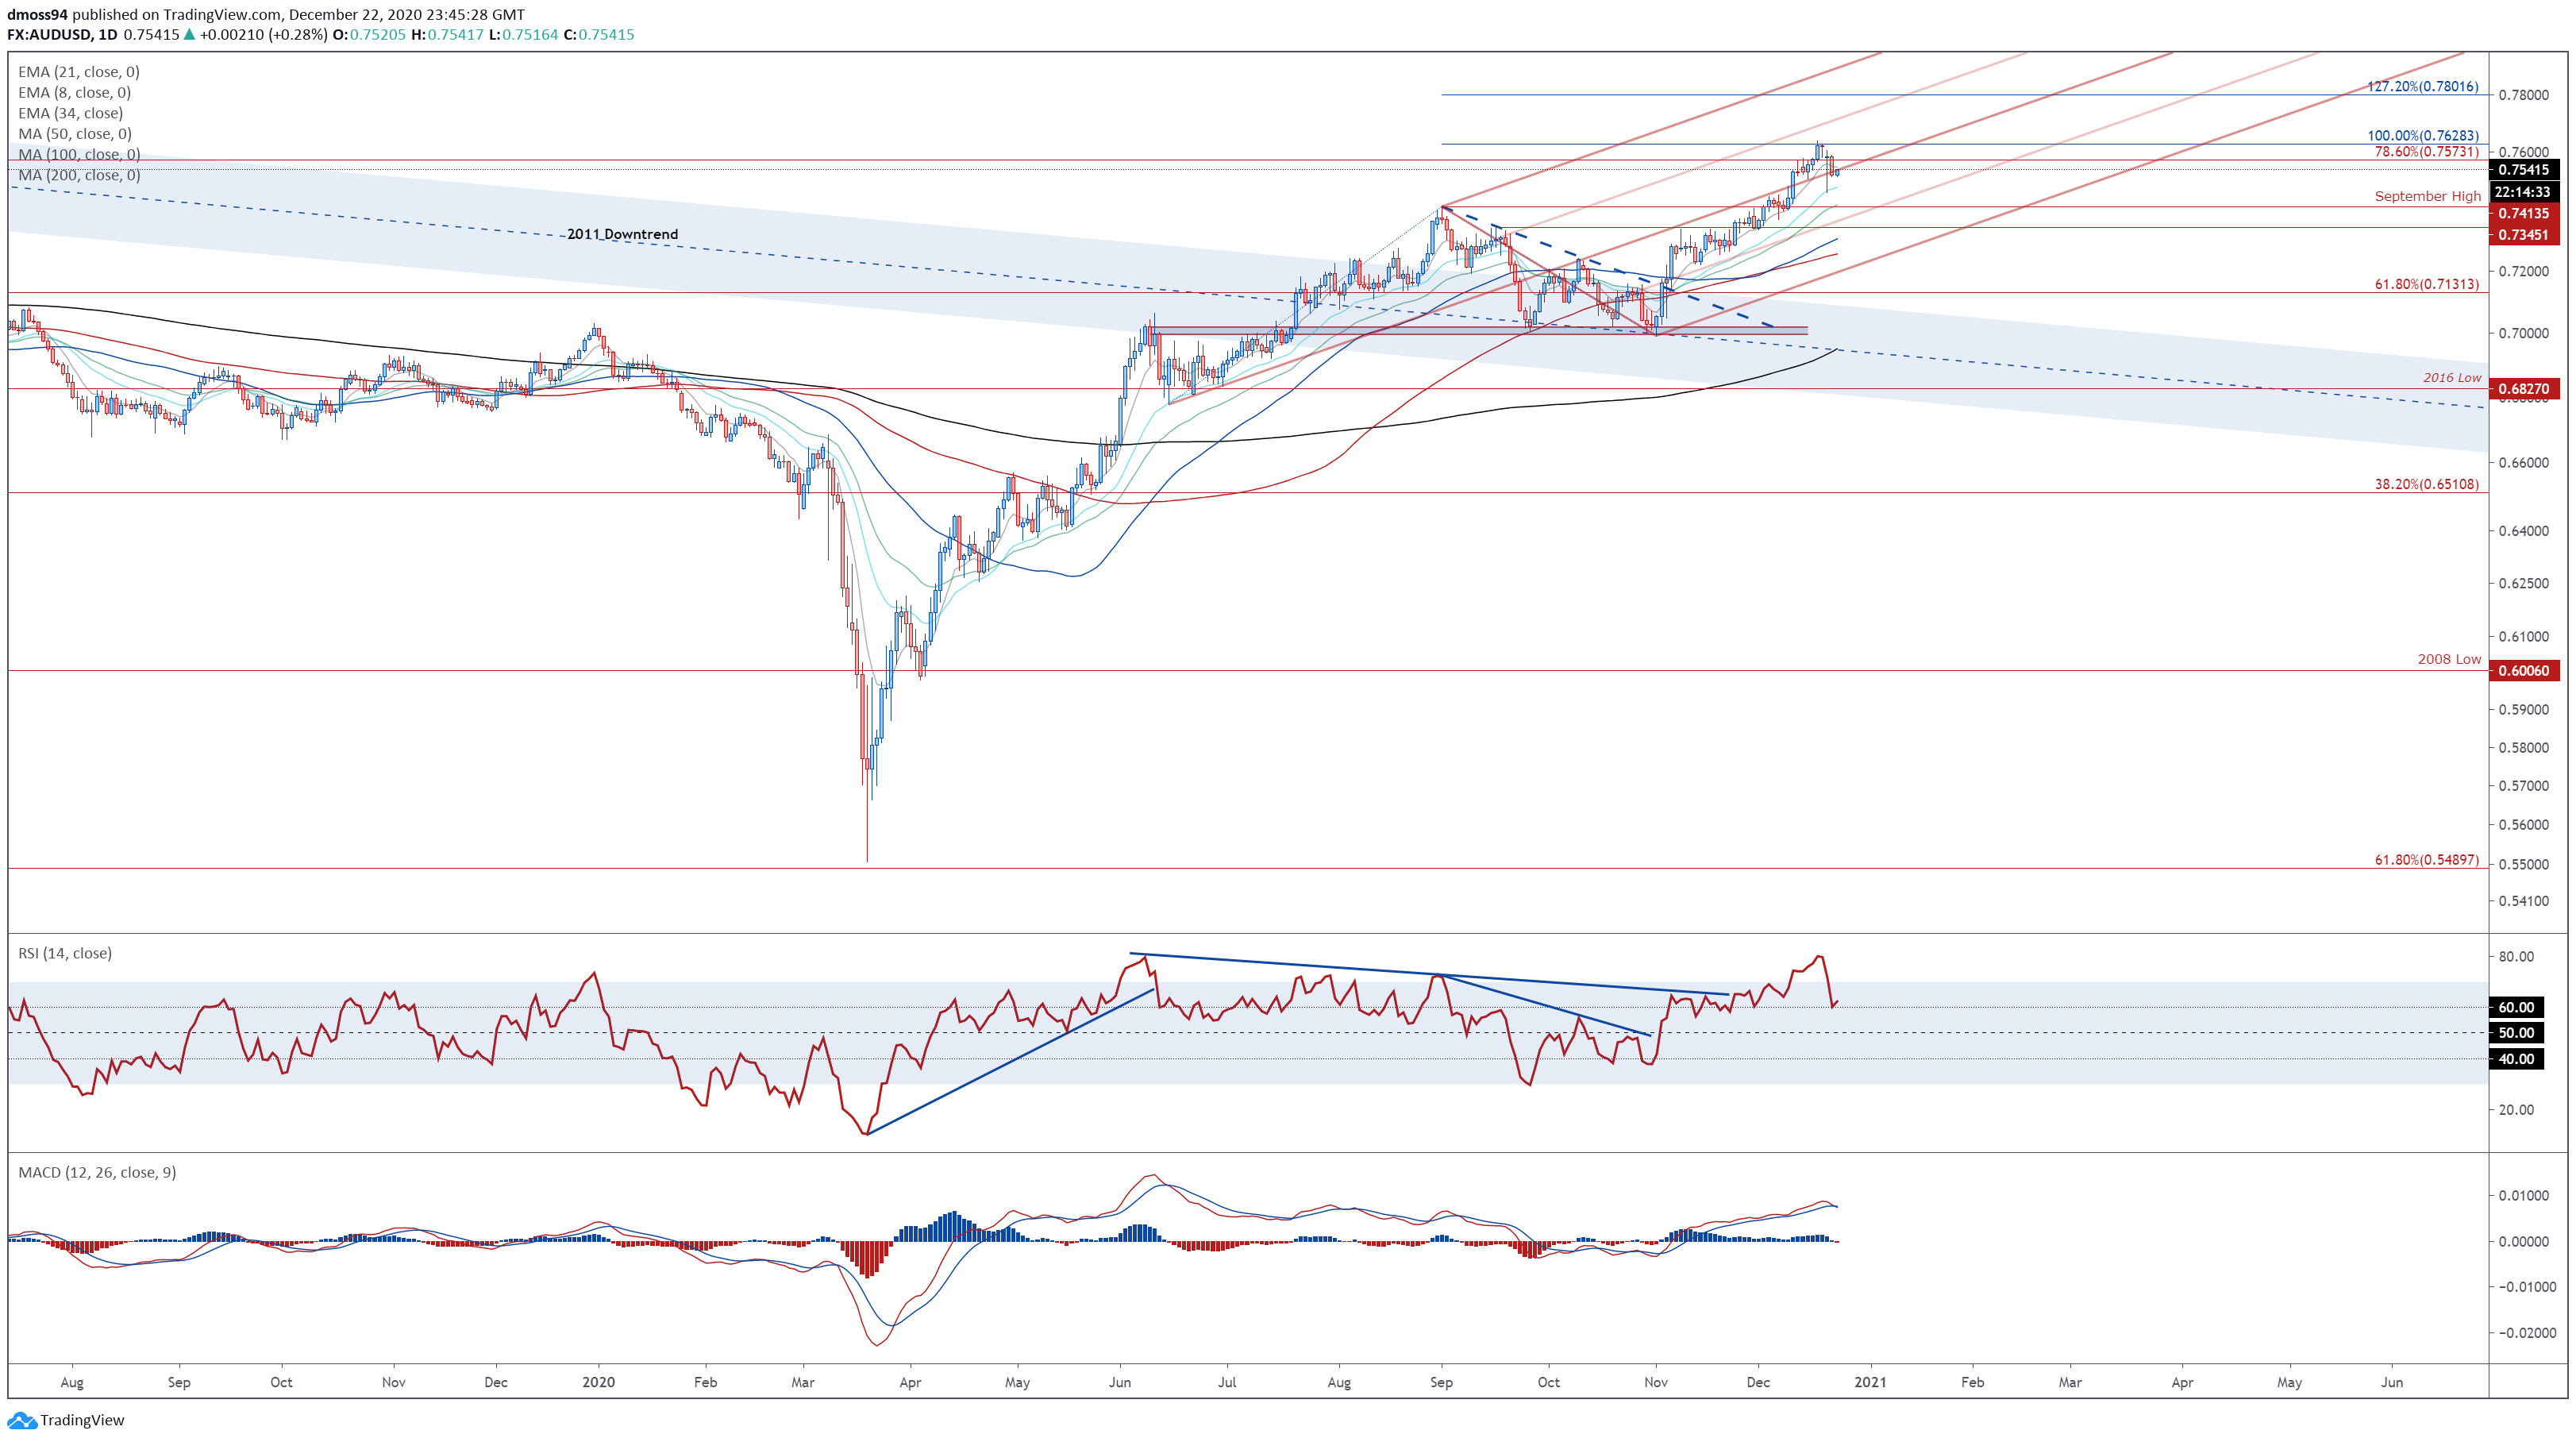
AUD/USD daily chart created using Tradingview
AUD/USD’s slide from the yearly high (0.7640) may also prove to be nothing more than a short-term pullback, as prices remain constructively positioned above psychological support at 0.7500.
With the RSI holding above 60, and the 50-DMA crossing back above the 100-DMA, further gains appear to be in the offing.
A daily close back above the 78.6% Fibonacci (0.7573) would likely neutralize near-term selling pressure and carve a path to retest the monthly high (0.7640).
Breaching that probably signals the resumption of the primary uptrend and brings the psychologically imposing 0.7800 mark into the crosshairs.
Conversely, failing to clamber back above the Pitchfork median line could allow sellers to drive price back towards the 21-DMA (0.7480).
AUD/USD 4-Hour Chart – Falling Wedge in Play
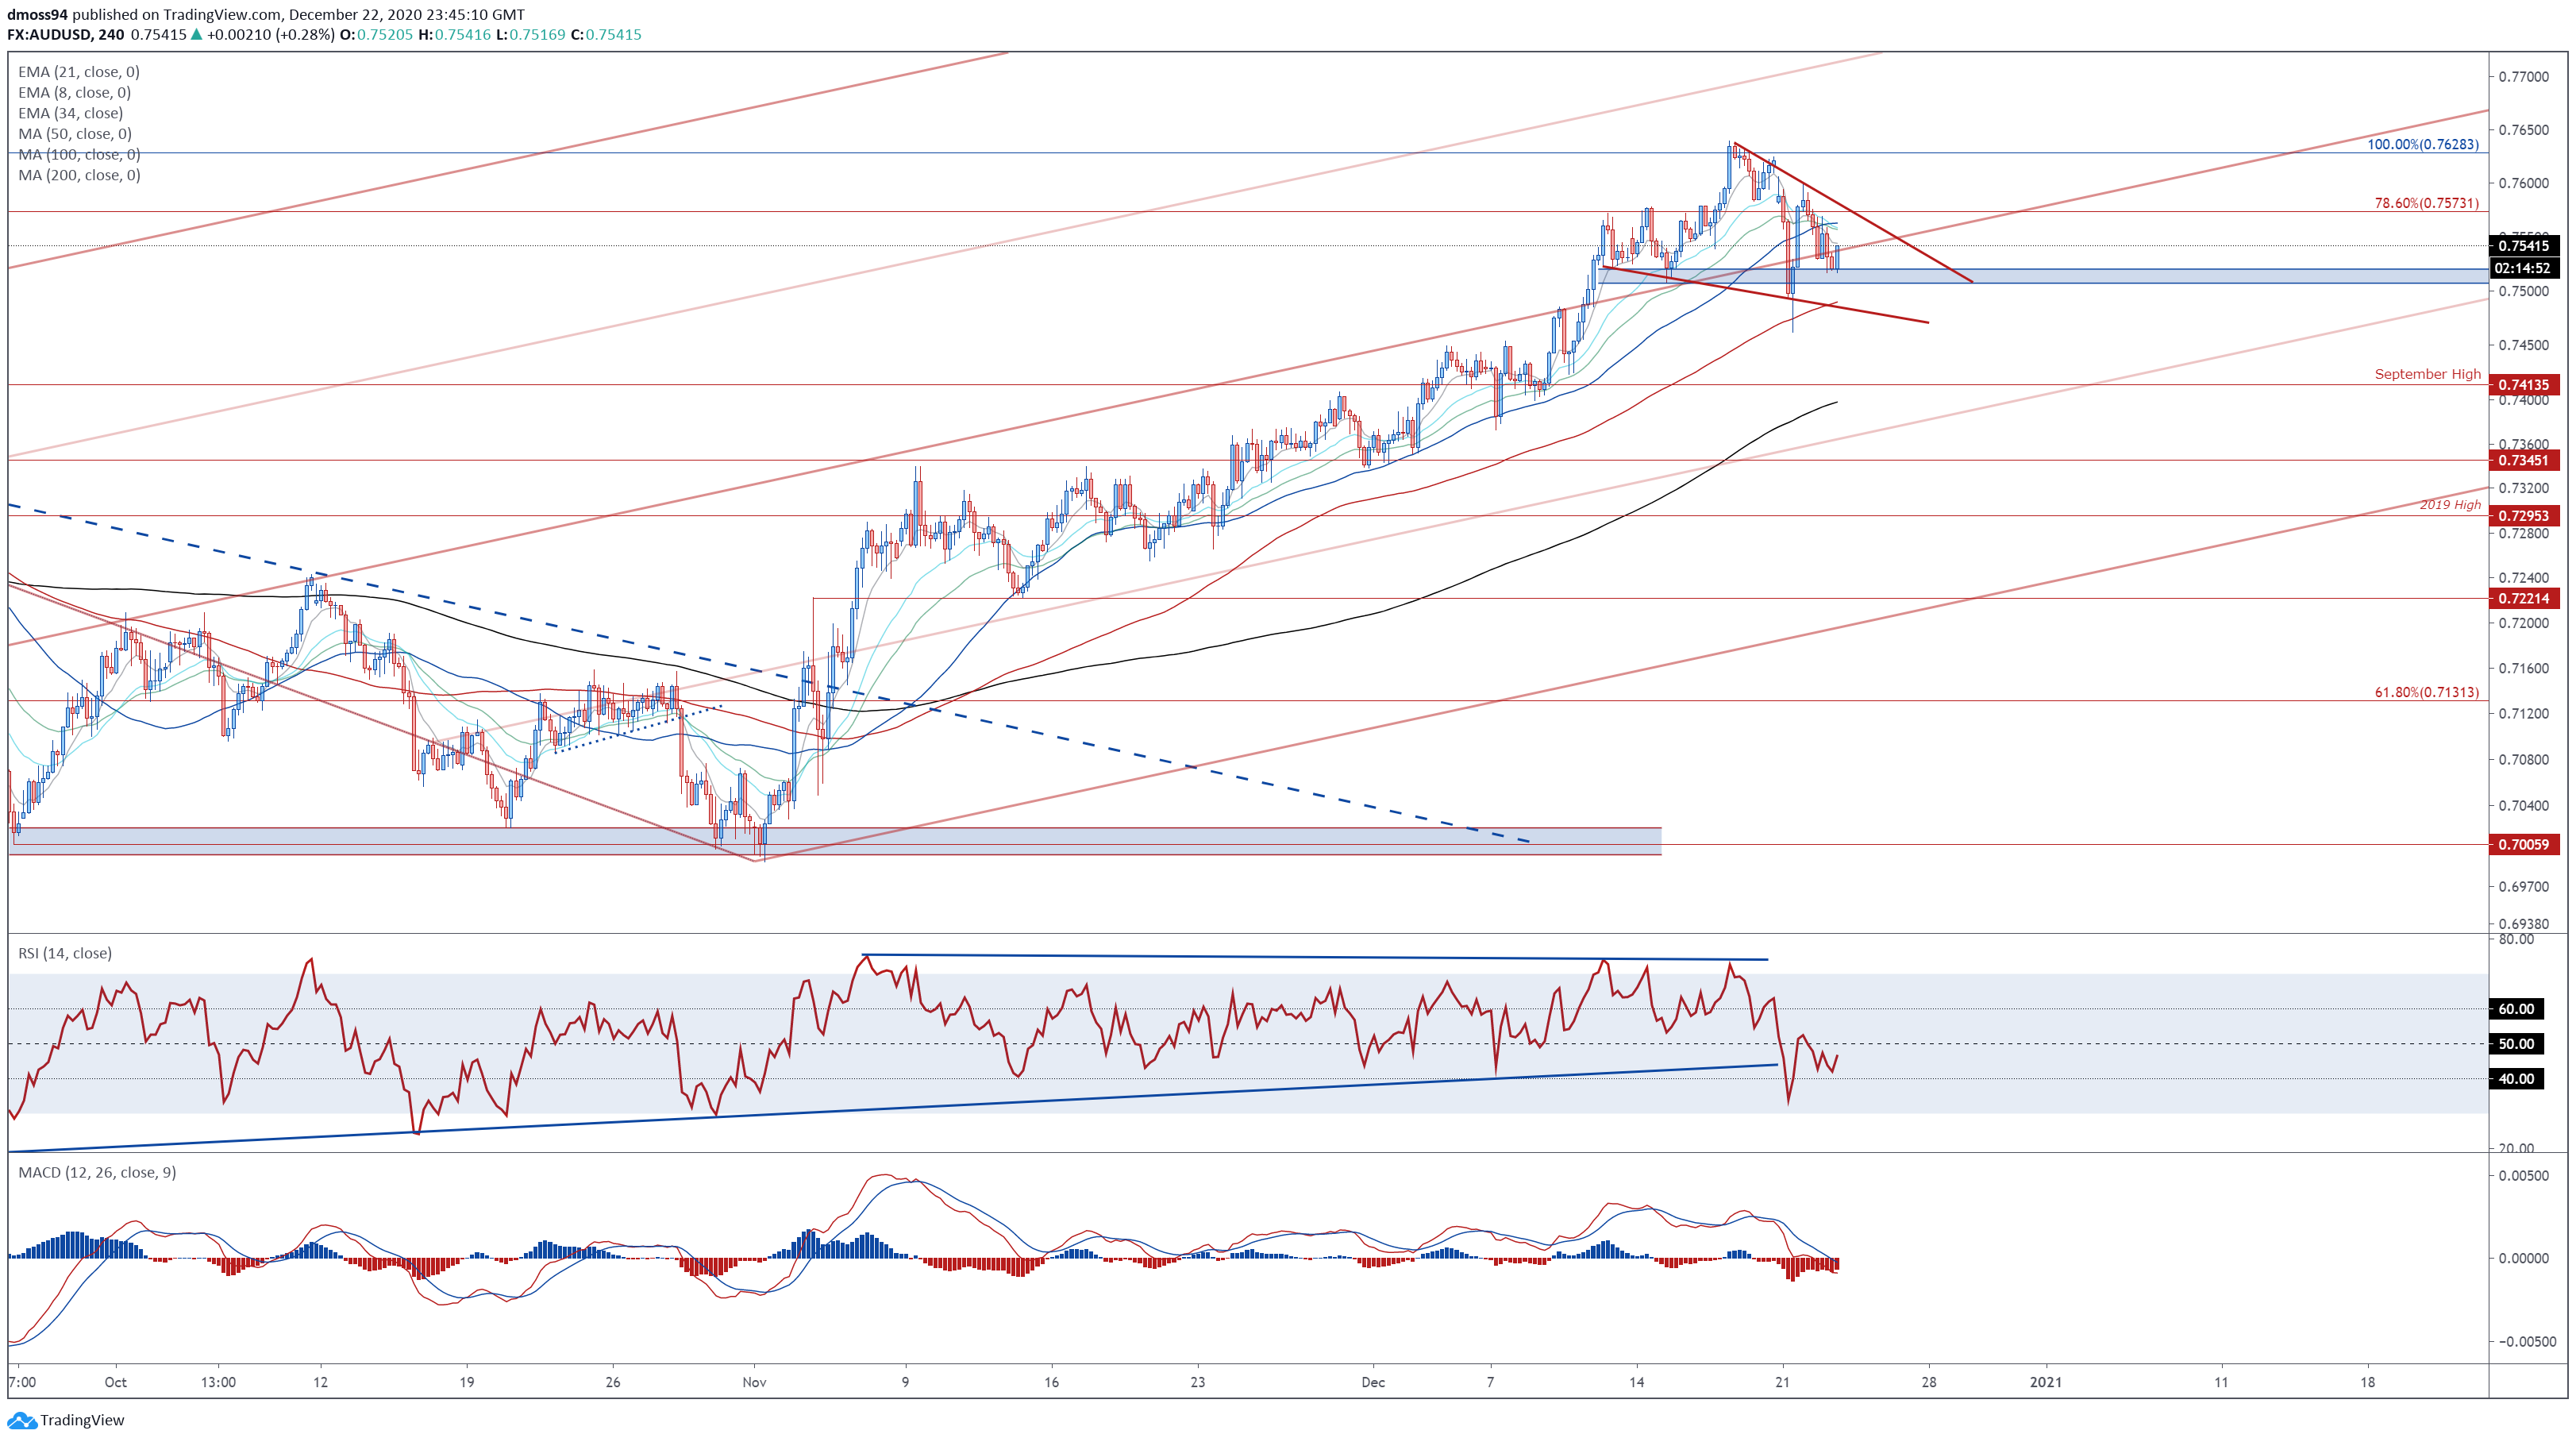
AUD/USD 4-hour chart created using Tradingview
In a similar fashion to its AUD/JPY counterpart, AUD/USD appears to be carving out a Falling Wedge pattern just above key psychological support at 0.7500.
With the RSI eyeing a push above its neutral midpoint, and price holding firmly above the support range at 0.7510 – 0.7520, a topside push looks likely in the coming days.
Ultimately, a push back above the 50-MA (0.7563) and wedge resistance is needed to validate the bullish pattern and carve a path to retest the 100% Fibonacci (0.7628) and yearly high (0.7640).
On the contrary, failing to hurdle the 50-MA could generate a retest of the support range at 0.7510 – 0.7520, with a break below probably precipitating a challenge of the 100-MA (0.7490).
| Change in | Longs | Shorts | OI |
| Daily | 2% | 3% | 2% |
| Weekly | 29% | -46% | 0% |
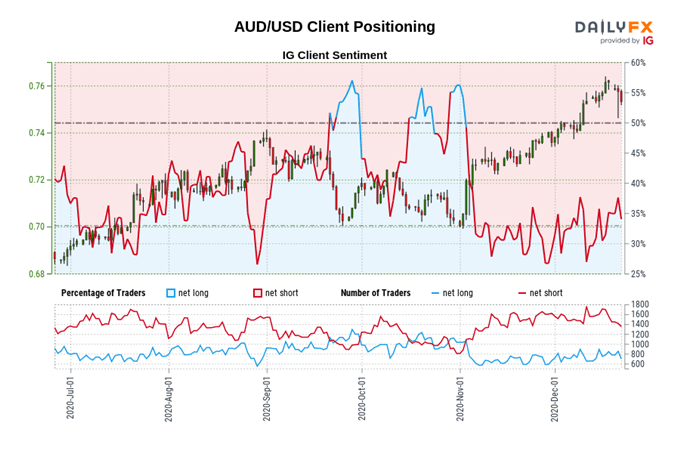
The IG Client Sentiment Report shows 36.56% of traders are net-long with the ratio of traders short to long at 1.74 to 1. The number of traders net-long is 1.05% lower than yesterday and 5.62% lower from last week, while the number of traders net-short is 4.38% higher than yesterday and 17.69% lower from last week.
We typically take a contrarian view to crowd sentiment, and the fact traders are net-short suggests AUD/USD prices may continue to rise.
Positioning is more net-short than yesterday but less net-short from last week. The combination of current sentiment and recent changes gives us a further mixed AUD/USD trading bias.
-- Written by Daniel Moss, Analyst for DailyFX
Follow me on Twitter @DanielGMoss


