


Australian Dollar Technical Price Outlook: Near-term Trade Levels
- Australian Dollar technical trade level update – Daily & Intraday Charts
- AUD/USD seven-week rally stalls– August open-range break to offer guidance
- Aussie constructive while above 7016- key resistance 7329
The Australian Dollar is fractionally higher against the US Dollar late in the week but leaves the recent Aussie rally vulnerable into the close as the monthly range takes shape just above the near-term technical support. These are the updated targets and invalidation levels that matter on the AUD/USD price charts. Review my latest Weekly Strategy Webinar for an in-depth breakdown of this Aussie trade setup and more.
Australian Dollar Price Chart – AUD/USD Daily
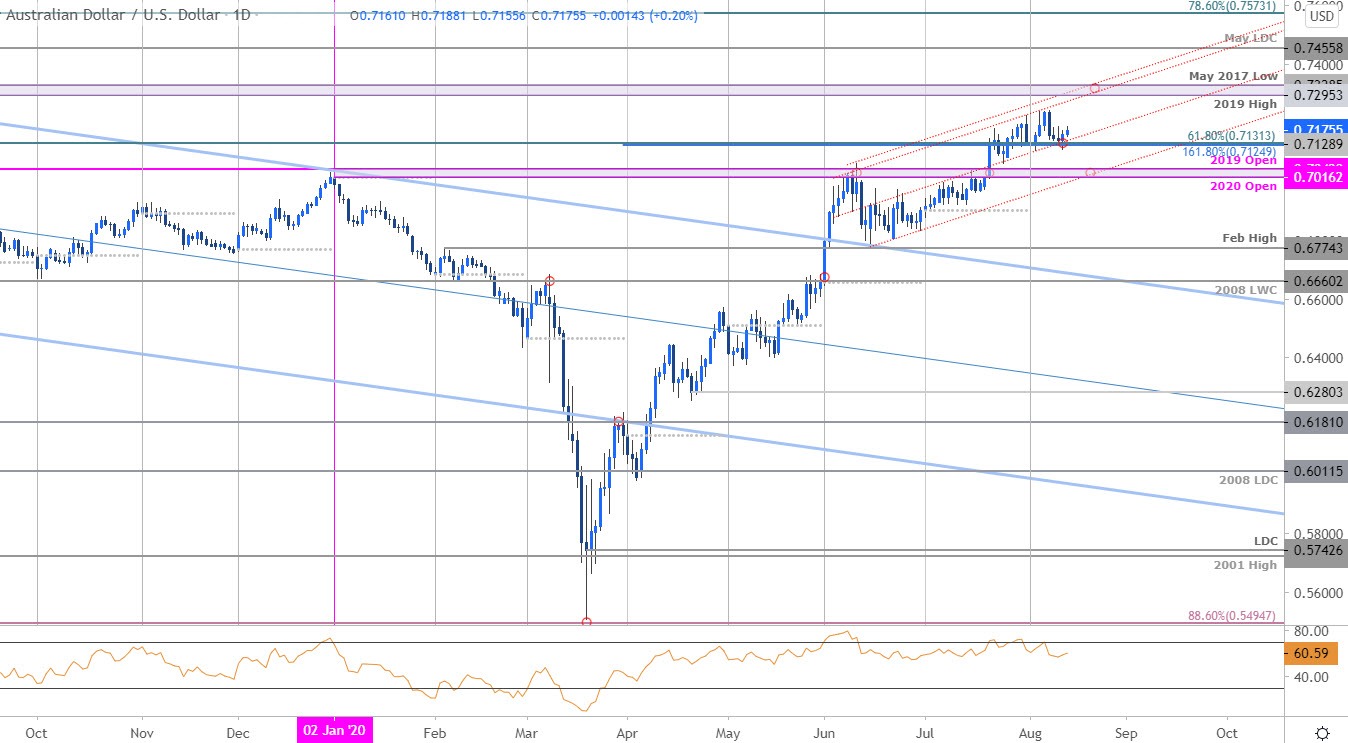
Chart Prepared by Michael Boutros, Technical Strategist; AUD/USD on Tradingview
Technical Outlook: In my last Australian Dollar Price Outlook we noted that, “while the broader outlook remains constructive, the immediate advance may be vulnerable after last week’s test of uptrend resistance.” Nearly half-way through August trade and Aussie continues to respect this up slope with the monthly opening-range taking shape just below.
Daily support rests at the 7125/31 confluence zone – a region defined by the key 61.8% Fibonacci retracement of the 2018 decline, the 1.618% ext of the late-March Rally and objective monthly open. Note that a parallel of the dominant slope also converges on this threshold and further highlights its technical significance- look for a reaction here. Broader bullish invalidation now raised to 7016/42 with key resistance steady at the 2019 high / March 2017 low at 7295-7328- a breach / daily close above this region is needed to mark resumption.
Australian Dollar Price Chart – AUD/USD 120min
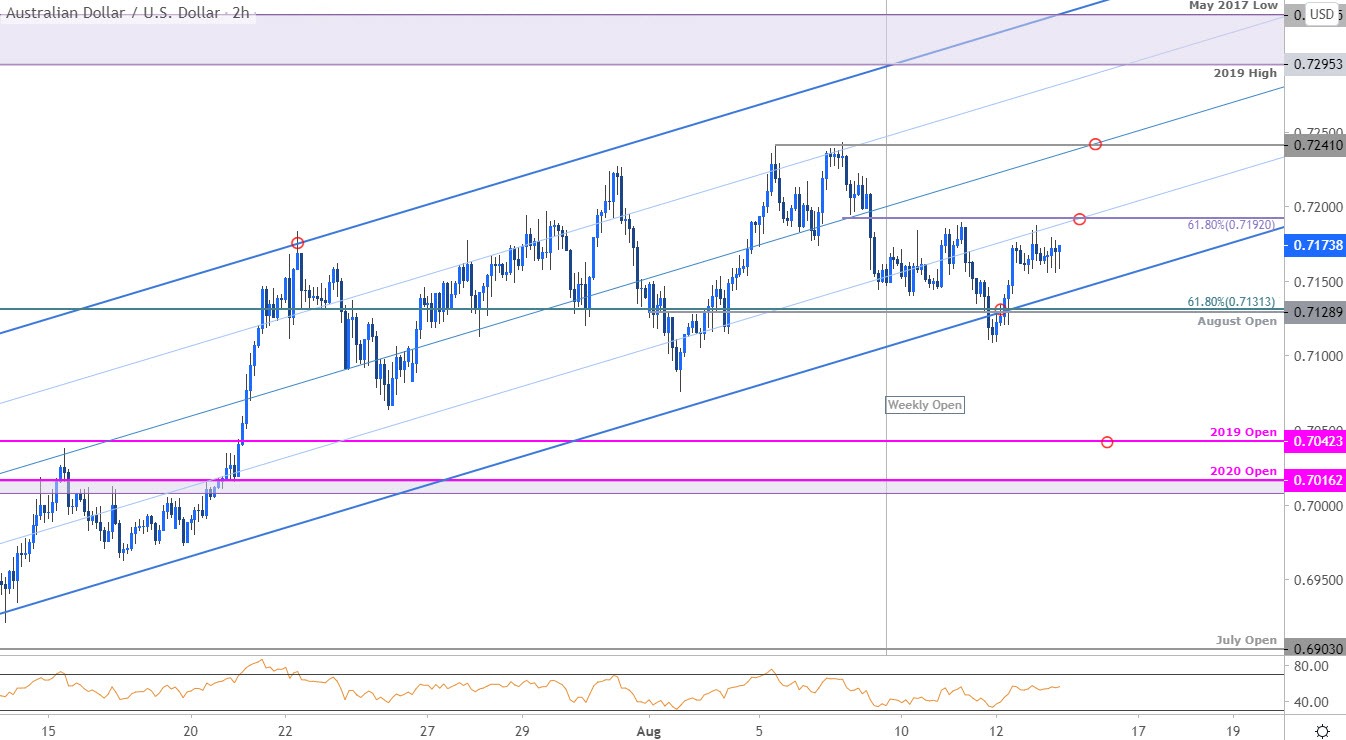
Notes: A closer look at Aussie price action shows AUD/USD trading continuing to trade within the confines of the ascending pitchfork formation we’ve been tracking off the late-June lows. A false break below support on Tuesday leaves the immediate focus on a break of the weekly opening-range; specifically, a break of the 7129-7192 zone. Ultimately a breach above median-line / monthly range highs at 7241would be needed to mark resumption towards longer-term resistance objectives at 7295 and 7328.

Bottom line: Australian Dollar has set the monthly opening-range just above lateral / uptrend support – look to the break to offer guidance with the broader outlook constructive while above 7016. From a trading standpoint, look for topside exhaustion ahead of the median-line IF price is indeed going to correct lower first – ultimately a larger pullback may offer more favorable opportunities closer to trend support. Review my latest Australian Dollar Weekly Price Outlook for a closer look at the longer-term AUD/USD technical trade levels
For a complete breakdown of Michael’s trading strategy, review his Foundations of Technical Analysis series on Building a Trading Strategy
Australian Dollar Trader Sentiment – AUD/USD Price Chart

- A summary of IG Client Sentiment shows traders are net-short AUD/USD - the ratio stands at -1.46 (40.70% of traders are long) – weak bullish reading
- Long positions are 1.59% higher than yesterday and 1.91% higher from last week
- Short positions are3.25% higher than yesterday and 2.24% lower from last week
- We typically take a contrarian view to crowd sentiment, and the fact traders are net-short suggests AUD/USD prices may continue to rise. Traders are more net-short than yesterday but less net-short from last week and the combination of current positioning and recent changes gives us a further mixed AUD/USD trading biasfrom a sentiment standpoint.
| Change in | Longs | Shorts | OI |
| Daily | 2% | 3% | 2% |
| Weekly | 29% | -46% | 0% |
---
Key Australia / US Data Releases
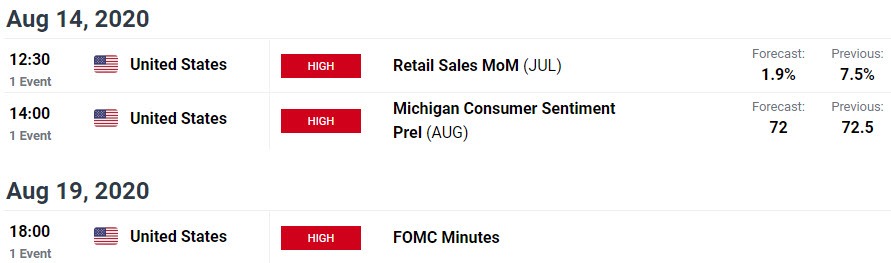
Economic Calendar - latest economic developments and upcoming event risk.
Active Trade Setups
- Canadian Dollar Outlook: USD/CAD Five Weeks Down, Five Month Low
- Gold Price Outlook: XAU/USD Crashes – Reversal or Retracement?
- Dollar vs Mexican Peso Price Outlook: USD/MXN Range Breakout Imminent
- Euro Dollar Outlook: EUR/USD Breakout Faces Key Fibonacci Resistance
- Written by Michael Boutros, Currency Strategist with DailyFX
Follow Michael on Twitter @MBForex


