


Aussie Dollar vs US Dollar Technical Outlook
AUD/USD – Indecisive Market
On June 15, AUD/USD declined to a two-week low at 0.6776. The price recovered all losses yet could not retest the previous week’s high highlighting that bulls were losing momentum. On Friday, the weekly candlestick closed with a Doji pattern reflecting the trader’s indecision at that point.
The market rallied on a V-shape recovery expectations driven by central bank stimulus around the globe and gradual easing of restrictions. Yet, the resurgence in coronavirus cases in the US and other countries knocked the investor’s confidence and drove them to slow down the US dollar selloff.
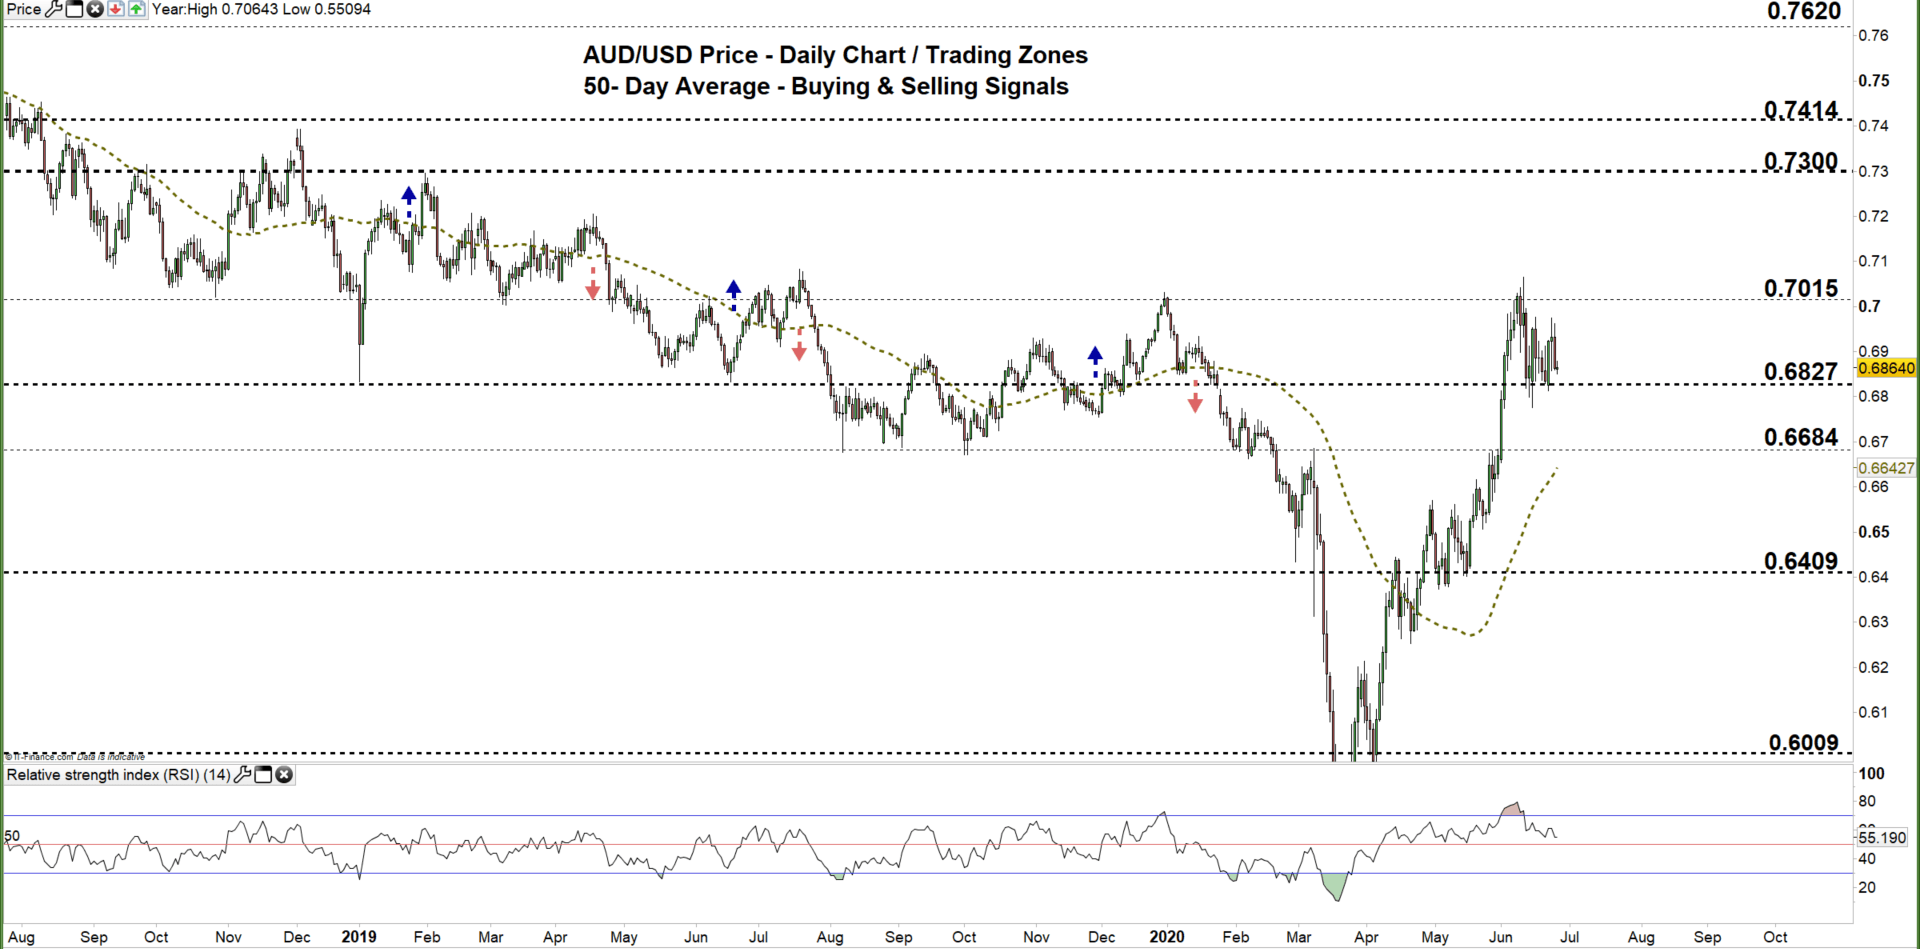
AUD/USD DAILY PRICE CHART (AUG 20, 2018 – June 25, 2020) Zoomed Out

AUD/USD DAILY PRICE CHART (FEB 13 – June 25, 2020) Zoomed IN

On June 10, AUD/USD soared to a near eleven-month high at 0.7064 however, the price reversed back to the current trading zone 0.6827 – 0.7015 as some bulls seemed to cut back.
Later on, the pair stabilized in the zone and traded in a sideways move creating a lower high with a higher low.
A close above the high end of the zone may resume bullish price action towards the 0.7300 handle. Any further close above that level could extend the rally towards 0.7414.
On the other hand, a close below the low end of the zone could spark a downside move towards 0.6684. Any further close below that level may encourage bears to press AUDUSD even lower towards 0.6409.

AUD/USD Four-Hour PRICE CHART (June 1 – June 25, 2020)

On Monday, AUD/USD broke above the lower line on the downtrend lines fan originated from the June 10 high at 0.7064 and generated a bullish signal. Yet the price coiled later eyeing a test of the uptrend line originated from the June 15 low at 0.6776. Hence, any violation of this line would generate a bearish signal. In turn, any break above the higher line on the downtrend lines fan would produce a bullish signal.
To conclude, a break below 0.6774 could send AUDUSD towards 0.6707 while, a break above 0.7085 may trigger a rally towards 0.7160.Nonetheless, the weekly support and resistance marked on the four-hour chart should be kept in focus.
Written By: Mahmoud Alkudsi, Market Analyst
Please feel free to contact me on Twitter: @Malkudsi


