


Aussie Dollar vs US Dollar Technical Forecast
- A combination of a weaker risk-on sentiment and bad data pauses AUD/USD rally
- Bearish signals on AUD vs USD price chart
AUD/USD – Bulls Pullback
On Wednesday, AUD/USD took off to a near eleven-month high at 0.7064 however, the price retreated after and closed the weekly candlestick in the red with a 1.4% loss.
The latest updates of a potential second wave of the Coronavirus in China and the resurgence of coronavirus cases in the US weighed on the market’s optimism and slowed down the US dollar selloff.
The Australian unemployment rate for May of 7.1% came worse than expected 7.0% nonetheless, with the eased lockdowns we may see an improvement in the unemployment numbers next month.
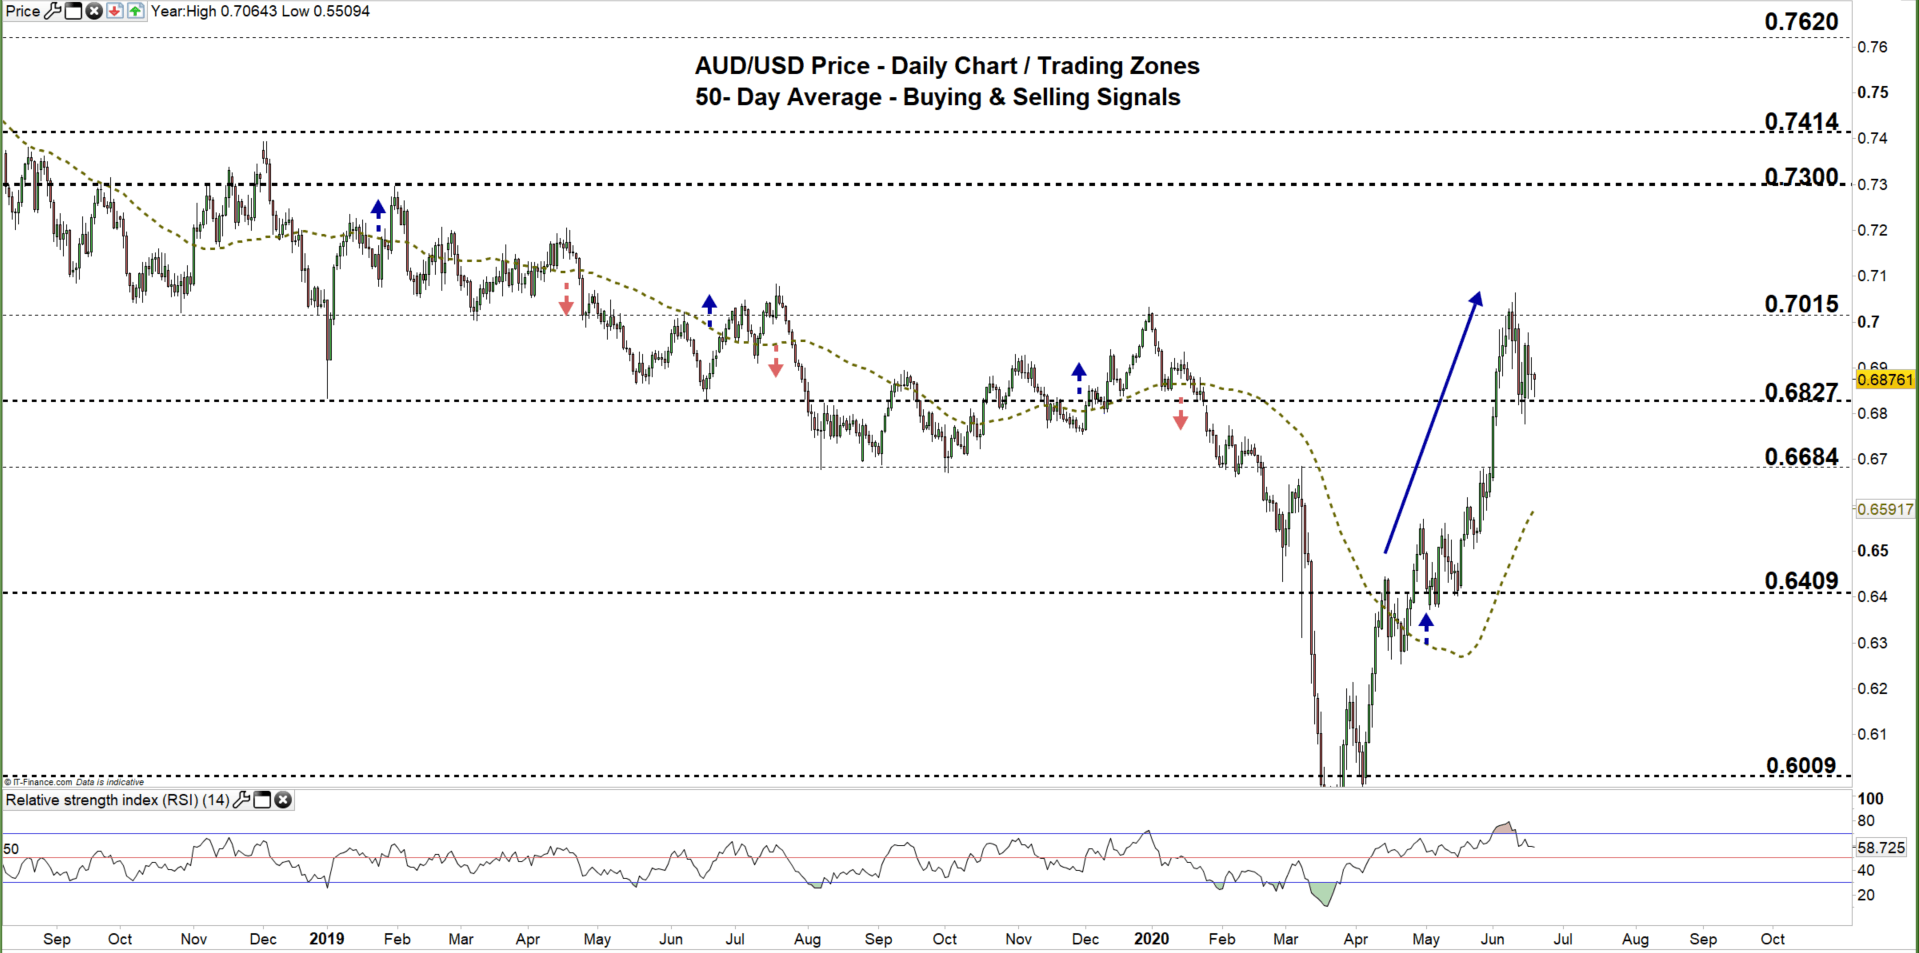
AUD/USD DAILY PRICE CHART (AUG 20, 2018 – June 18, 2020) Zoomed Out

AUD/USD DAILY PRICE CHART (FEB 13 – June 18, 2020) Zoomed IN

On May 19, AUD/USD resumed bullish price action creating higher highs with higher lows. However, on June 9 the price declined to the current trading zone 0.6827 – 0.7015 reflecting a weaker bullish sentiment.
A close below the low end of the aforementioned trading zone would correct the price lower and could send AUDUSD towards 0.6684. Any further close below that level may send the pair even lower towards 0.6409.
On the other hand, any close above the high end of the zone signals that bulls could push towards the 0.7300 handle. Any further close above that level may encourage bulls to extend the rally towards 0.7414.
See the daily chart (zoomed in) to know more about the key levels to monitor in both scenarios.

AUD/USD Four-Hour PRICE CHART (MAy 15 – June 18, 2020)
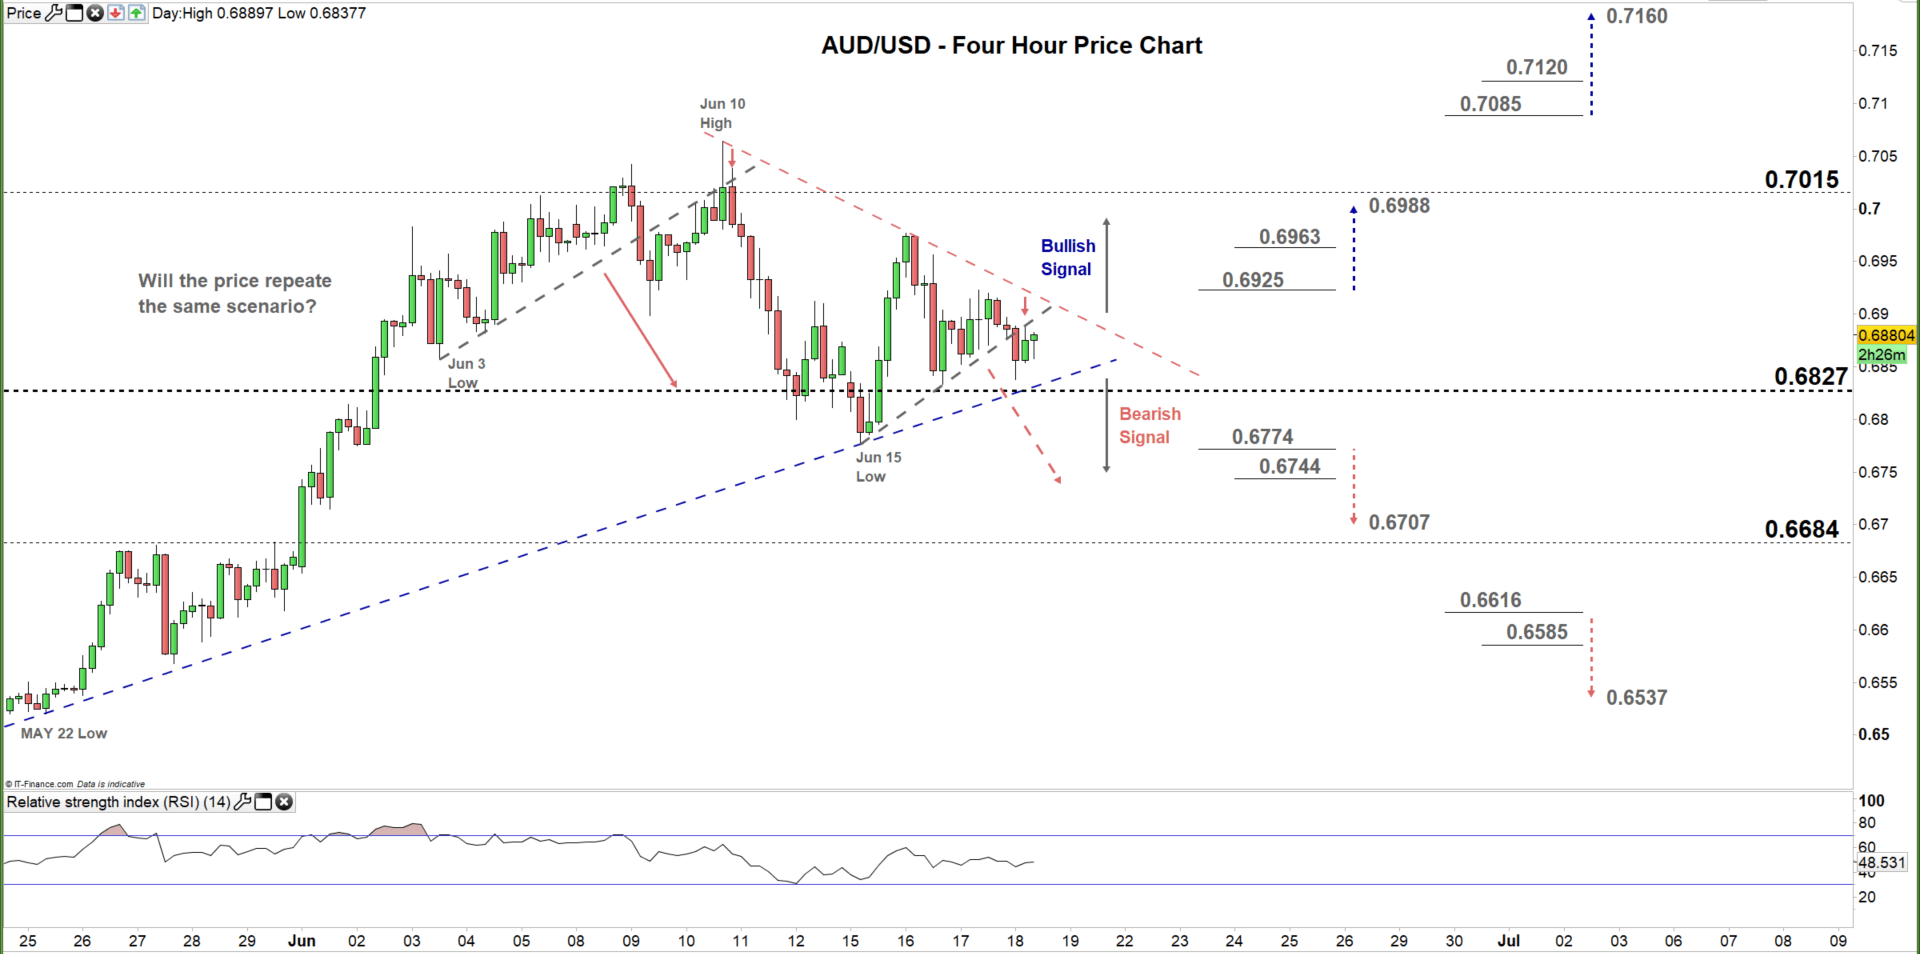
On June 9, AUD/USD broke below the uptrend line originated from the June 3 low at 0.6856, and generated a bearish signal. On the following day, the price failed to rally above this line then declined further.
Today, the price broke below the uptrend line originated from the June 15 low at 0.6776 then rebounded from the same line later. Therefore, any violation of the uptrend line originated from the May 22 low at 0.6519 would generate another bearish signal while any break above the downtrend line originated from the June 10 high at 0.7064 would generate a bullish signal.
To conclude, a break below 0.6774 could send AUDUSD towards 0.6707 while, a break above 0.6925 may trigger a rally towards 0.6988.Nonetheless, the daily support and resistance marked on the four-hour chart should be kept in focus.
Written By: Mahmoud Alkudsi, Market Analyst
Please feel free to contact me on Twitter: @Malkudsi


