


Aussie Dollar vs US Dollar Technical Forecast
- U.S. Fed reserve challenges market optimism on the global economy
- AUD vs USD price chart exposes a weaker bullish sentiment
AUD/USD – A Multi-Month High
On Friday, AUD/USD rallied to a six-month high at 0.7013 then closed the weekly candlestick in the green with a 4.5% gain. The optimism of a quicker economic recovery increased demand on risk-sensitive assets such as the Australian dollar and lower demand for safe havens.
Yesterday, the Fed kept interest rates at 0.25% and hinted that they may continue unchanged until at least 2022. The Fed chair Powell stressed that the recovery would be a long road and dependent on the path of the Coronavirus.
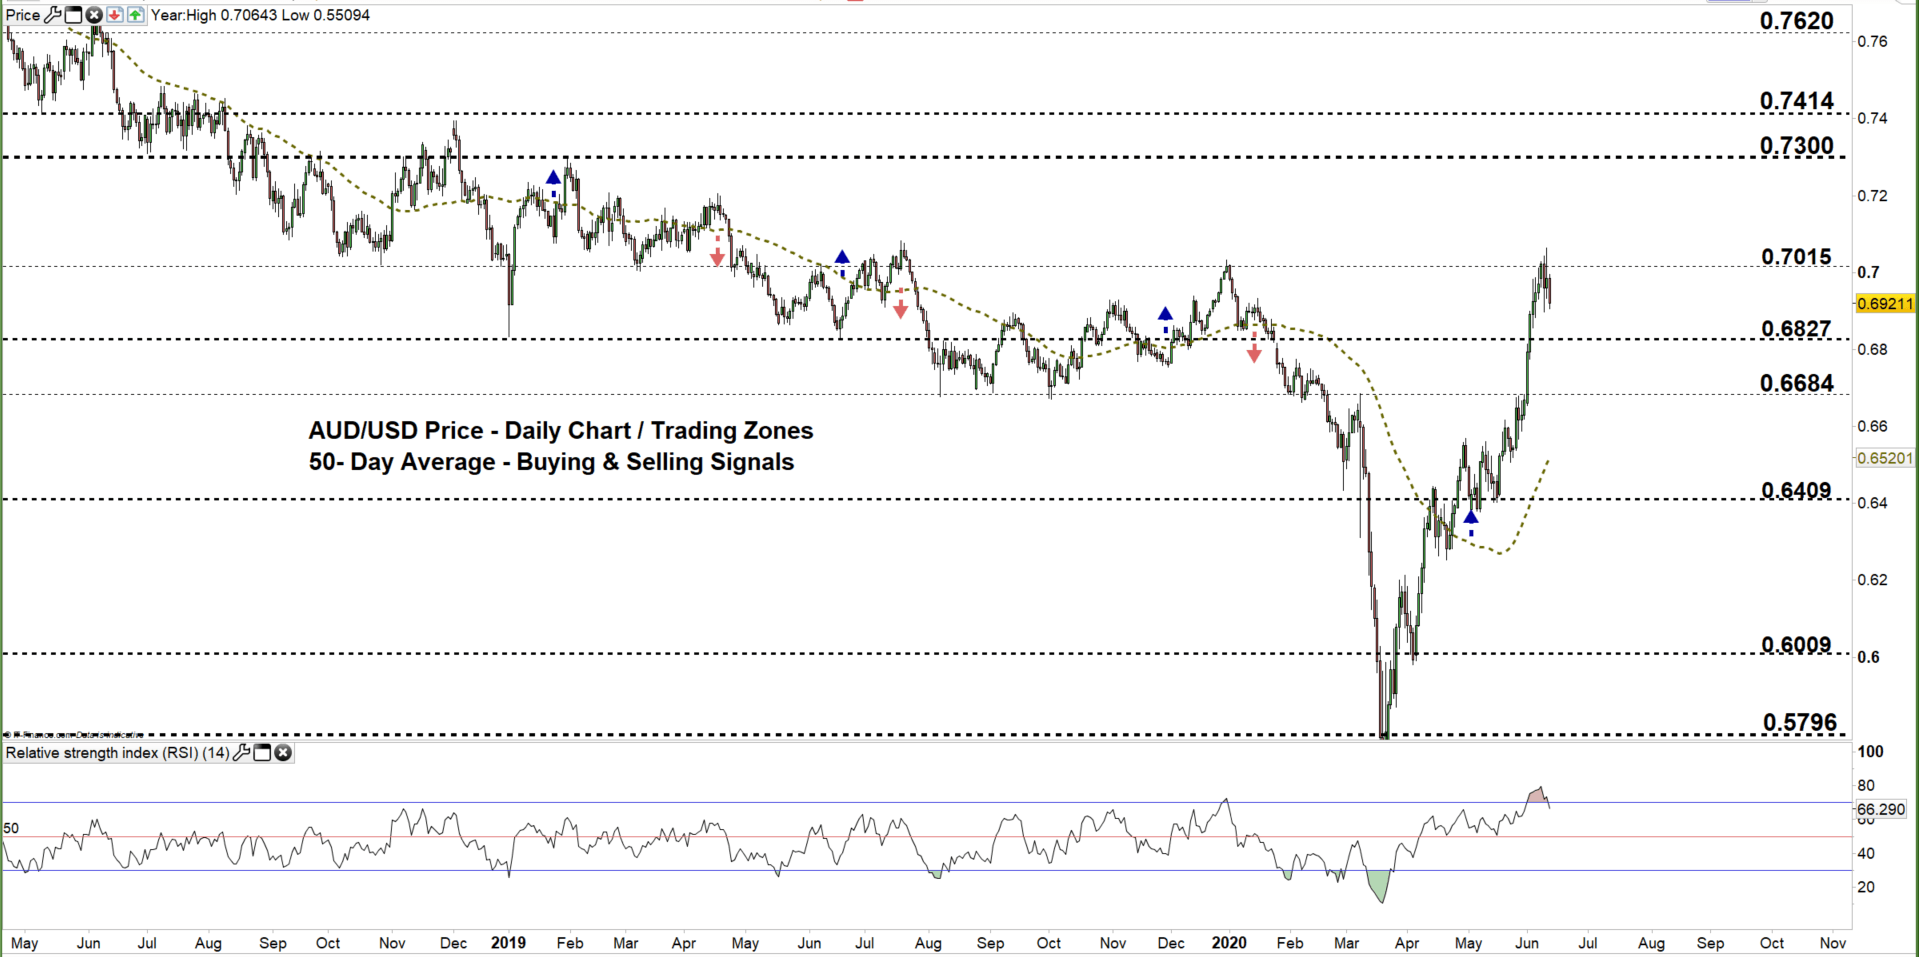
AUD/USD DAILY PRICE CHART (AUG 20, 2018 – June 11, 2020) Zoomed Out

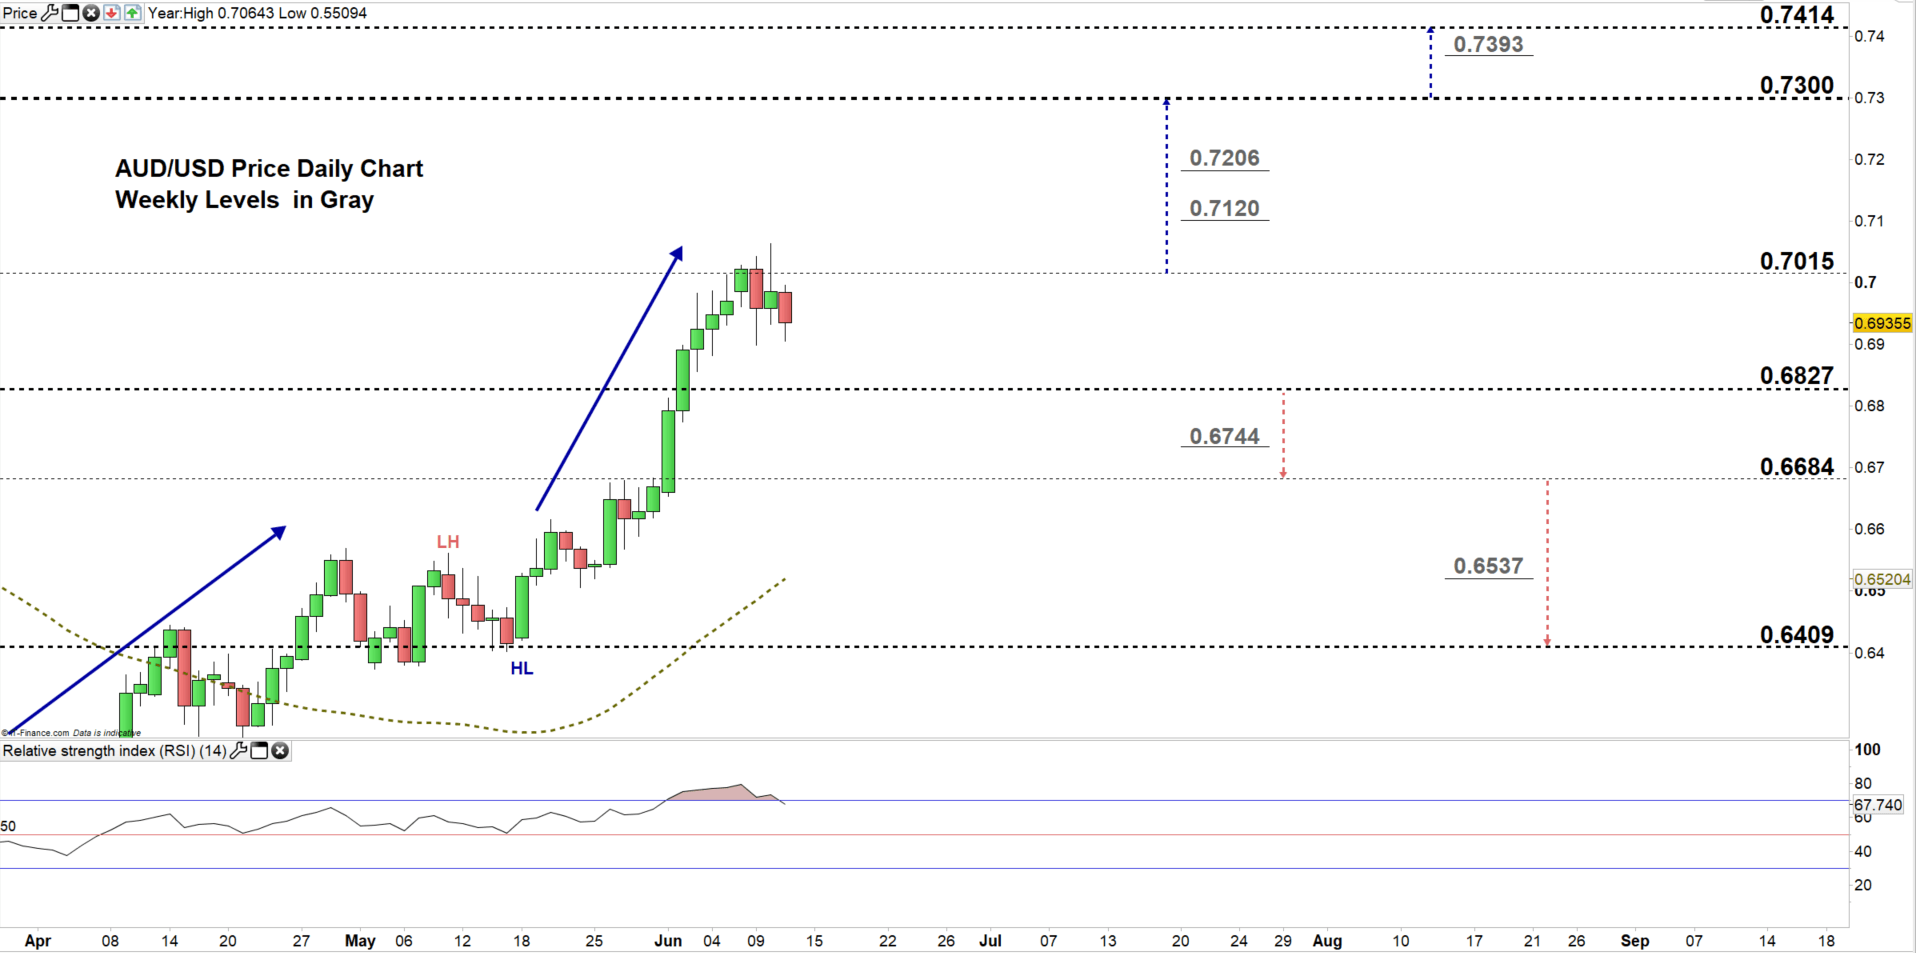
AUD/USD DAILY PRICE CHART (FEB 13 – June 11, 2020) Zoomed IN
On May 11, AUD/USD corrected its upward trend and created a lower high at 0.6561 yet the pair resumed bullish price action in the week after and printed yesterday its highest level in over ten months at 0.7064. Nonetheless, the pair returned to the current trading zone 0.6827 – 0.7015 as some bulls seemed to cut back.
A close below the low end of the aforementioned trading zone signals bulls hesitation and possibly send the price towards 0.6684. Any further close below that level could send AUDUSD even lower towards 0.6409.
Any close above the high end of the zone reflects that bulls could push towards the 0.7300 handle and a further close above that level may encourage them to extend the rally towards 0.7414.
See the daily chart (zoomed in) to know more about the key levels to monitor in both scenarios.

AUD/USD Four-Hour PRICE CHART (MAy 15 – June 11, 2020)
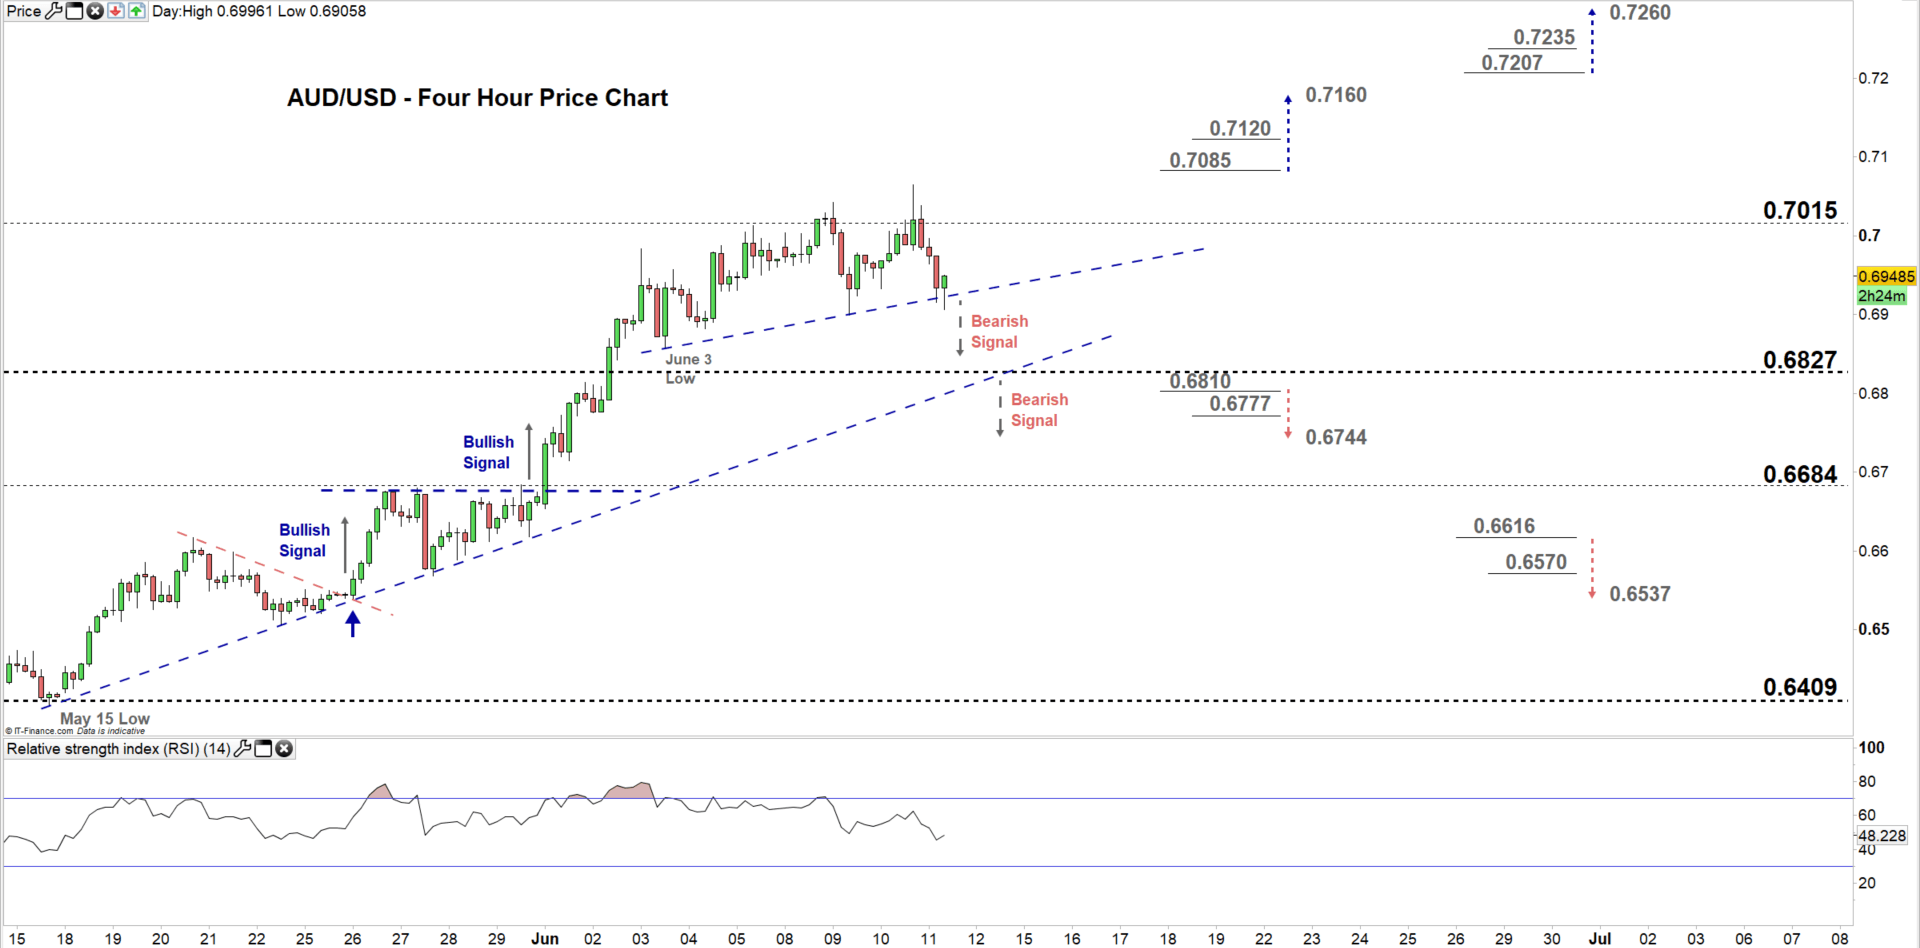
On June 1, AUD/USD broke above the upper line of the ascending triangle residing at 0.6677 and generated a bullish signal. On June 5, the price rebounded from the high end of the current trading zone discussed above on the daily chart and flattened its upward trend indicating that bulls were losing momentum. Therefore, any violation of the uptrend line originated from the June 3 low at 0.6856 would be considered a bearish signal.
Thus, a break below 0.6810 could send AUDUSD towards 0.6744 while, a break above 0.7085 may trigger a rally towards 0.7160.Nonetheless, the daily support and resistance marked on the four-hour chart should be kept in focus.
Written By: Mahmoud Alkudsi, Market Analyst
Please feel free to contact me on Twitter: @Malkudsi


