


Aussie Dollar vs US Dollar Technical Forecast
- Bulls are still in control
- AUDUSD rallies to a higher trading zone, what’s next?
AUD/USD- Bullish Comeback
On Tuesday, AUD/USD declined to a near two weeks low at 0.6253. Later on, the price rallied and settled above 0.6300 handle. On Friday, the price closed with a bullish Doji pattern, signaling the bullish outlook of the market. Today, the market took off to 0.6469 – its highest level in over seven weeks.
Alongside that, the Relative Strength Index (RSI) rebounded from 50 then pointed higher indicating that bullish momentum was still intact.
AUD/USD DAILY PRICE CHART (July 1, 2018 – April 27, 2020) Zoomed Out
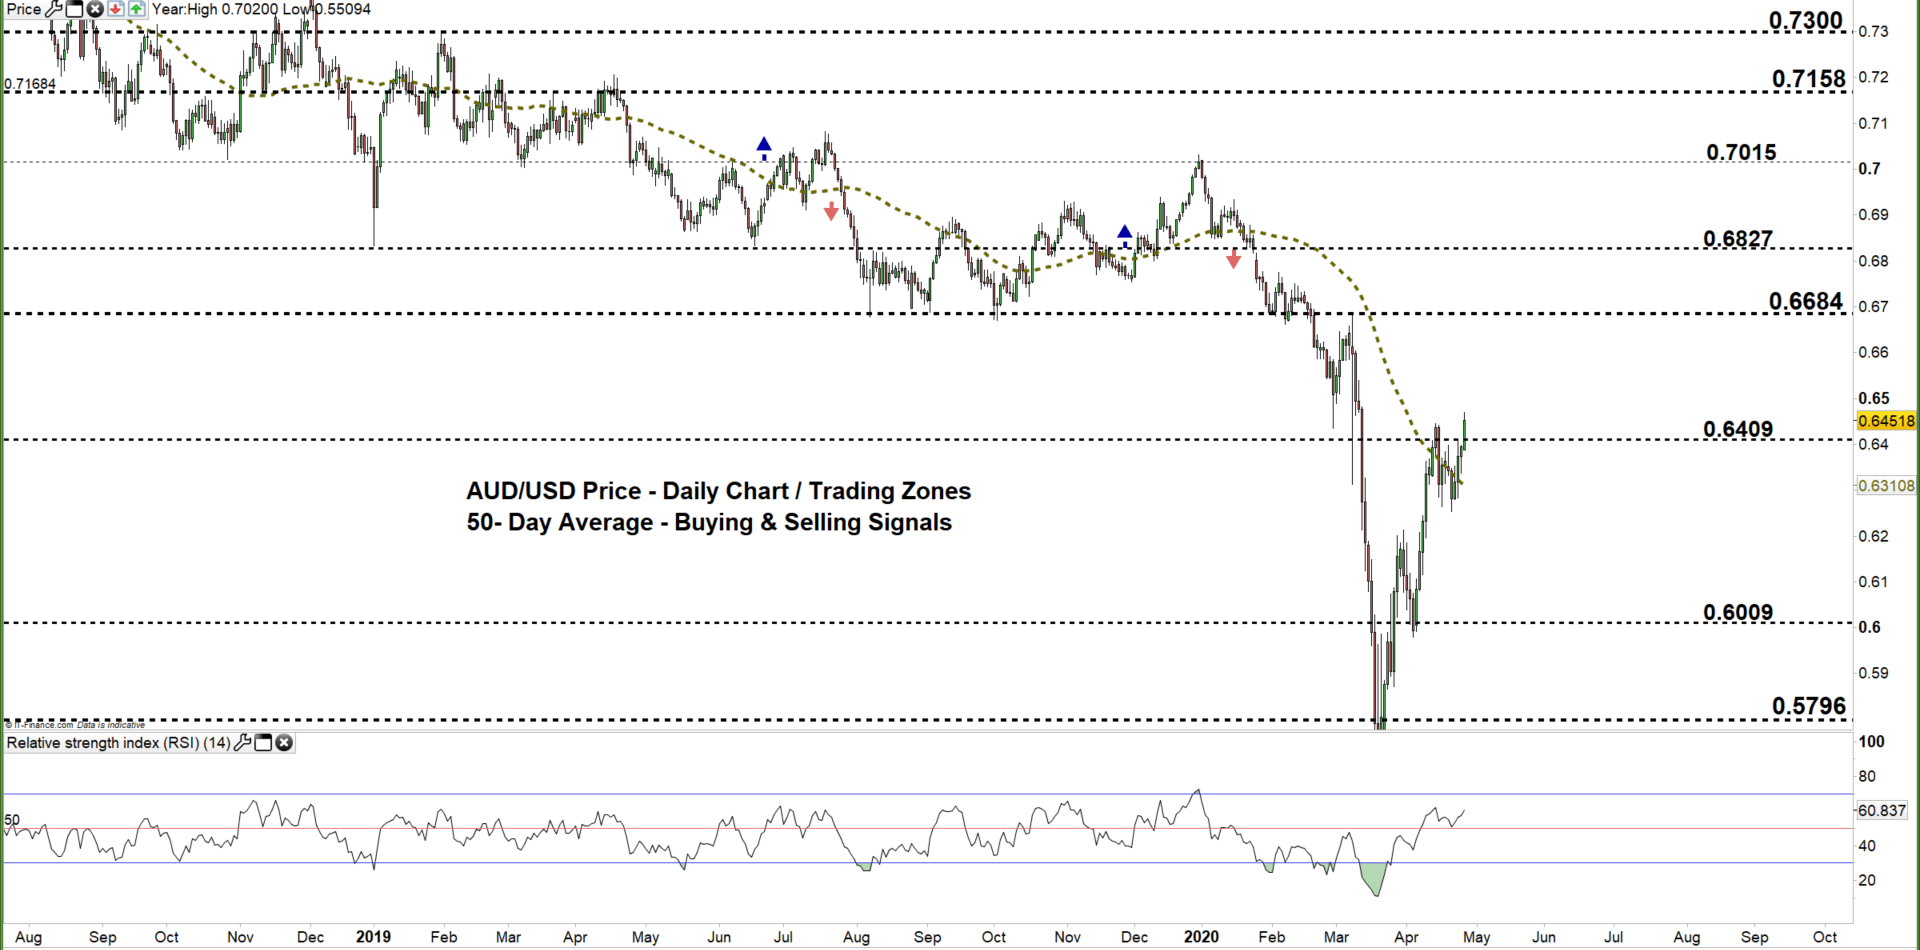

AUD/USD DAILY PRICE CHART (FEB 20 – April 27, 2020) Zoomed IN

Looking at the daily chart, we noticed that on Thursday AUD/USD rallied then closed above the 50-day moving average signaling a possible bullish comeback. On Friday, the market rallied further then closed above the downtrend line originated from the March 9 High at 0.6685 providing another bullish signal. Today, the price has climbed to a higher trading zone 0.6409 – 0.6684.
A close above the low end of the zone reflects a stronger bullish sentiment. This could cause a rally towards the high end of the zone. A further close above that level might extend the rally towards 0.6827. Although, the weekly resistance levels underlined on the chart (zoomed in ) should be considered.
On the flip side, a close below the low end of the zone highlights bull’s hesitation. That said, it would require more than one failure to conclude a weakening bullish momentum. In that scenario, AUDUSD may fall towards 0.6009. A further close below that level could send the price even lower towards 0.5796. Nevertheless, the daily and weekly support levels underscored on the chart would be worth monitoring.

AUD/USD Four-Hour PRICE CHART (Mar 20 – April 27, 2020)
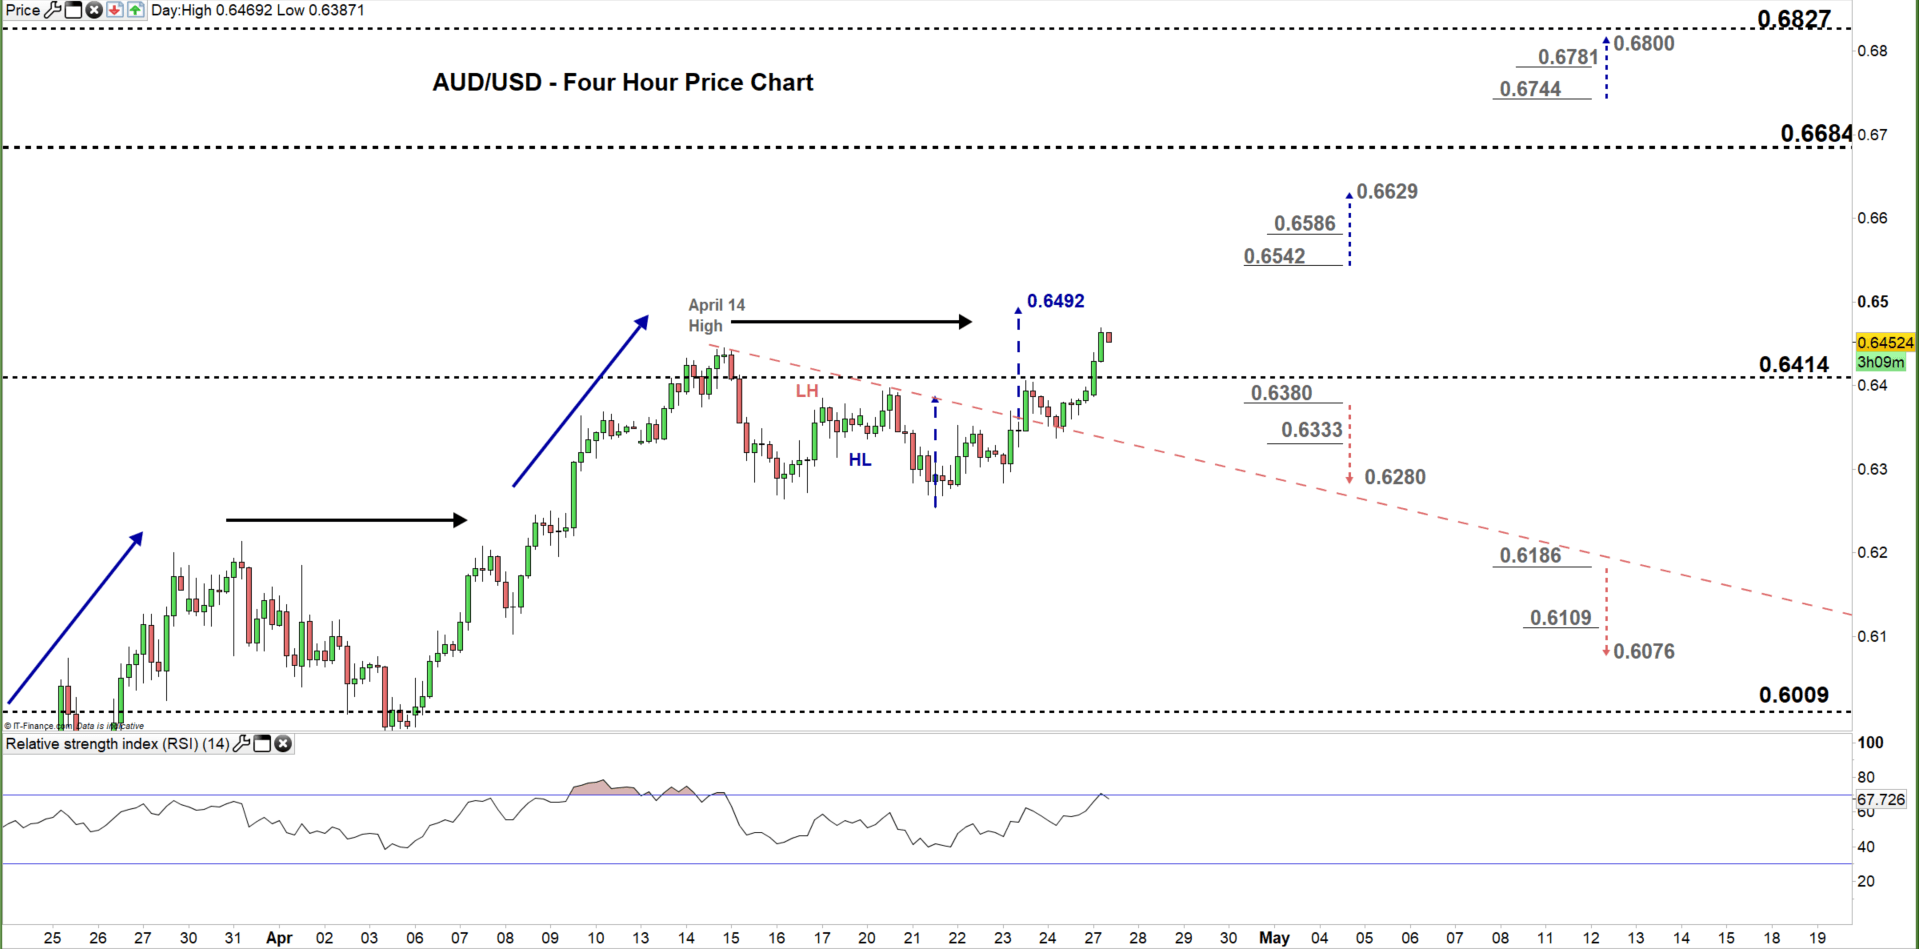
From the four- hour chart, we noticed that on April 14 AUD/USD peaked at 0.6443 then started a sideways move creating lower highs with higher lows. On Thursday, the price broke above the downtrend line originated from the April 14 high eyeing a test of 0.6492.
A break above 0.6542 would be a bullish signal and may cause a rally towards 0.6629. That said, the resistance level at 0.6586 should be watched closely. In turn, a break in the other direction i.e. below 0.6380 could send AUDUSD towards 0.6280. Yet, the daily support level printed on the chart should be kept in focus.
See the chart to find out more about key technical levels in a further bullish/bearish scenario.

Written By: Mahmoud Alkudsi, Market Analyst
Please feel free to contact me on Twitter: @Malkudsi


