


Aussie Dollar vs US Dollar Technical Forecast
- Weaker downtrend move, yet bears have not given up control
- Signals and trading zones to consider on AUD vs USD chart
AUD/USD- Interrupted Recovery
Last week, Aussie Dollar rallied against US Dollar and printed 0.6214 – its highest level in nearly three weeks. However, the price fell after, and settled below the 0.6000 threshold. On Friday, the weekly candlestick closed in the red with 2.6% loss.
Alongside that, the relative Strength Index (RSI) abandoned oversold territory yet, remined below 50 highlighting that downtrend move was still intact.
AUD/USD DAILY PRICE CHART (DEC 1, 2018 – April 6, 2020) Zoomed Out


AUD/USD DAILY PRICE CHART (DEC1 – April 6, 2020) Zoomed IN
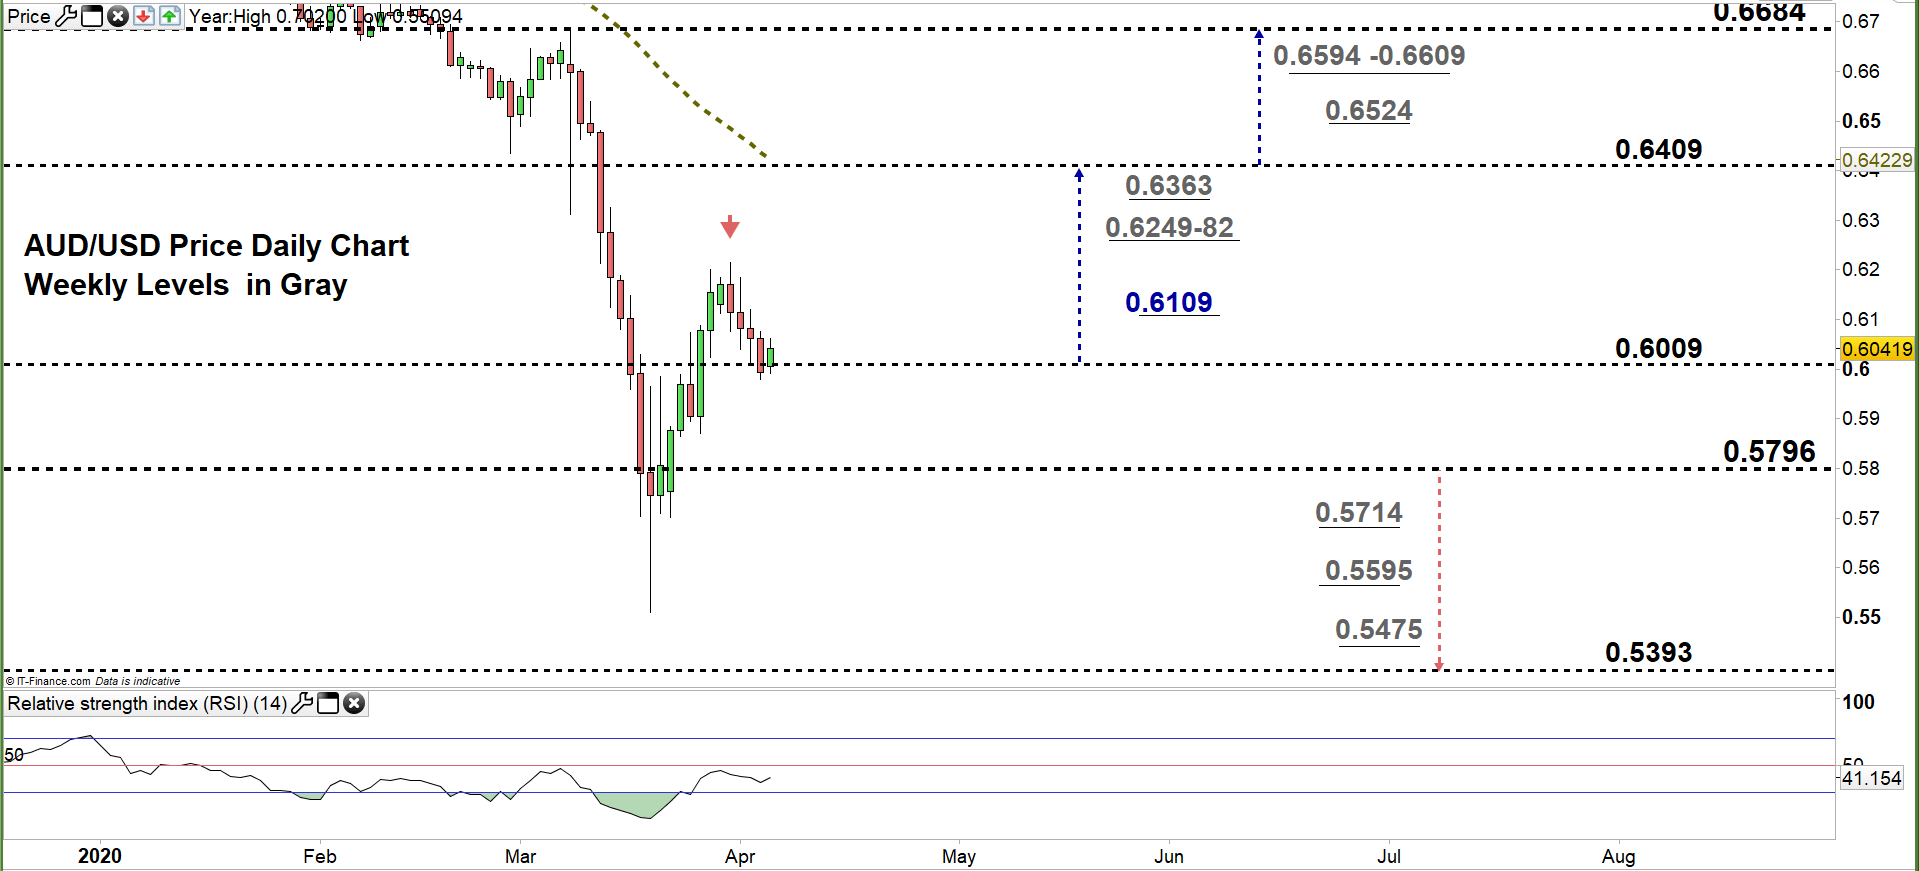
Looking at the daily chart, we noticed that at the start of last week AUD/USD U turned and pressed towards current trading zone 0.5796 – 0.6009 indicating that bears were not done yet.
That said, any close above the high end of the zone reflects bears hesitation. This could cause a rally towards 0.6409. Further close above that level could extend the rally towards 0.6684. In that scenario, the daily and weekly resistance areas and levels marked on the chart (zoomed in) should be watched closely.
On the other hand, another close below the high end of the zone may encourage bears to press towards the low end of it. Further close below that level could send AUDUSD even lower towards 0.5393. Having said that, the weekly support levels underscored on the chart should be monitored.

AUD/USD Four-Hour PRICE CHART (Mar 18 – April 6, 2020)
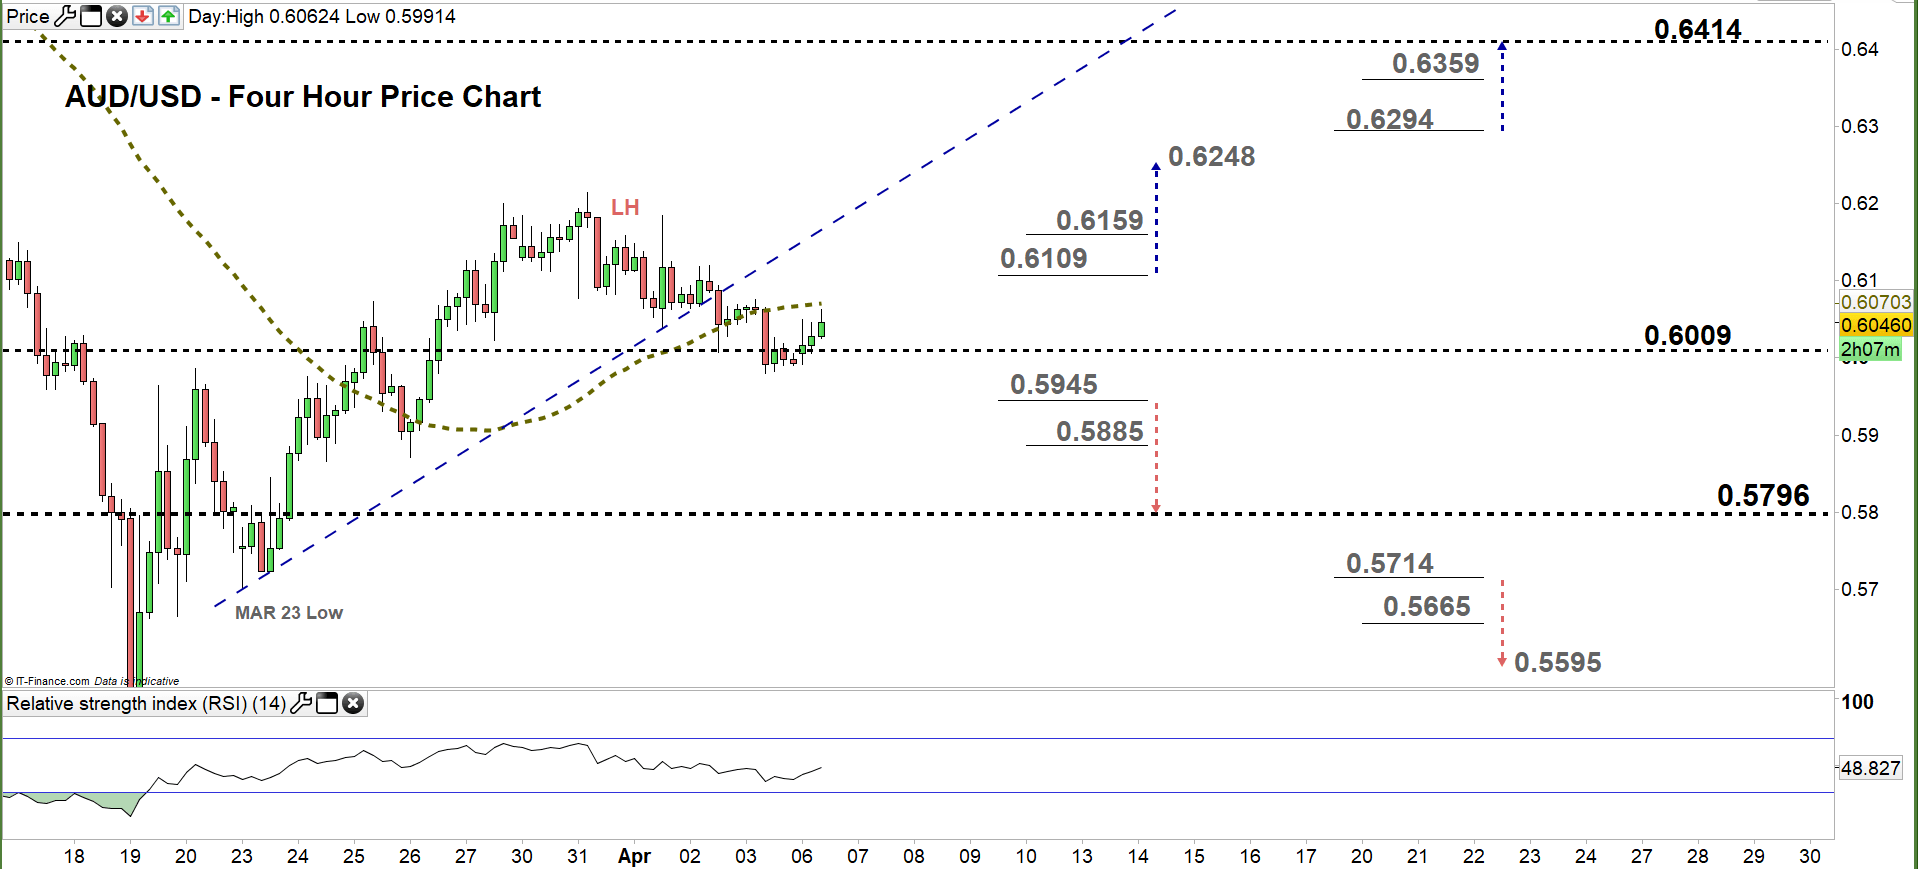
From the four- hour chart, we noticed that on Tuesday AUD/USD corrected its uptrend move as curved out a lower high at 0.6159. On Thursday, the price leaned to the downside and broke below the uptrend line originated from the March 23 low at 0.5700, then created a lower high with a lower low.
Thus, a break below 0.5945 could be considered another bearish signal. This increases the likelihood for AUDUSD to test 0.5796. Yet, the weekly support underlined on the chart should be kept in focus. In turn, any break in the other direction i.e. above 0.6109 may cause a rally towards 0.6248. Nevertheless, the daily resistance level printed on the chart should be considered.

Written By: Mahmoud Alkudsi
Please feel free to contact me on Twitter: @Malkudsi


