


AUD/USD TECHNICAL OUTLOOK: BEARISH
- Australian Dollar digesting losses after hitting nearly 18-year low
- 4-hour chart hints sellers may be ready to resume the downtrend
- Trader sentiment studies warn bearish confirmation still needed
The Australian Dollar is digesting losses after dropping to support at 0.5567, the 100% Fibonacci expansion. Breaking below this barrier on a daily closing basis probably opens the door for a challenge of the October 2000 – August 2002 congestion region in the 0.5185-0.5292 zone.
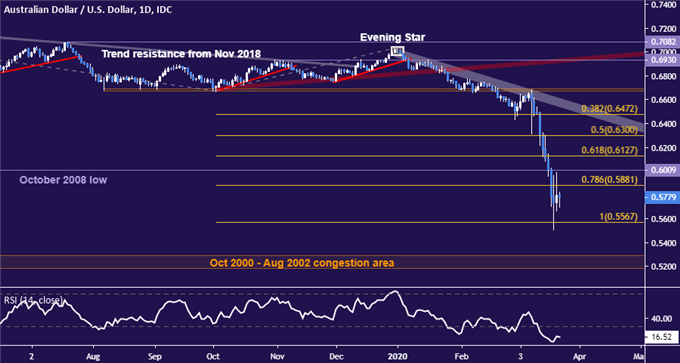
AUD/USD daily chart created with TradingView
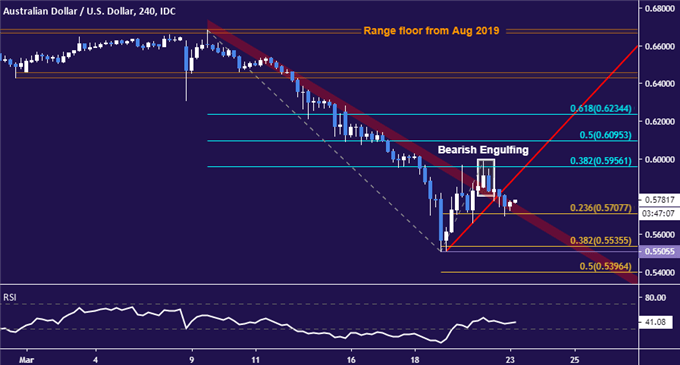
Zooming in to the 4-hour chart for a sense of near-term positioning, it looks like the AUD/USD selloff may be preparing to resume. Prices put in a Bearish Engulfing candlestick pattern at Fib resistance and slipped below the rising countertrend line guiding a tepid upswing from the March 18 low.
A break below the 23.6% expansion at 0.5708 may serve as confirmation, taking out the immediate range floor as well as former resistance at a falling trend line set from the beginning of the month and now recast as support. A challenge of the 0.5506-36 zone likely follows thereafter.
AUD/USD TRADER SENTIMENT
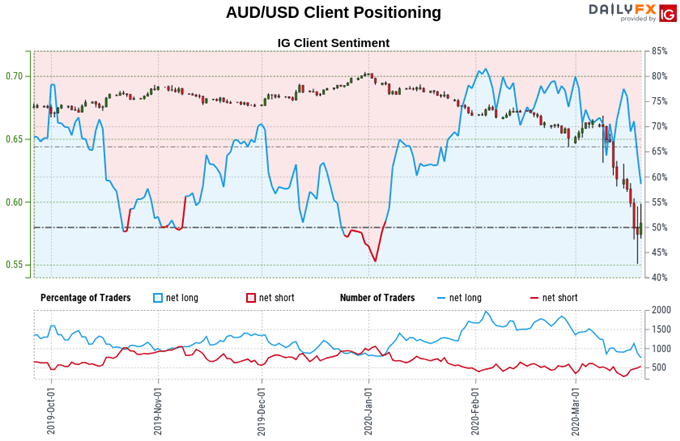
Retail sentiment data shows 59.54% of traders are net-long, with the long-to-short ratio at 1.47 to 1. IG Client Sentiment (IGCS) is typically used as a contrarian indicator, so traders being net-long suggests AUD/USD may continue to fall.
However, the number of traders net-long is 19.72% lower from last week while the net-short exposure is up 63.67% over the same period. This undermines conviction in the bearish bias implied in overall positioning, making for a clouded outlook.
See the full IGCS sentiment report here.

FX TRADING RESOURCES
- Just getting started? See our beginners’ guide for FX traders
- Having trouble with your strategy? Here’s the #1 mistake that traders make
- Join a free live webinar and have your trading questions answered
--- Written by Ilya Spivak, Currency Strategist for DailyFX.com
To contact Ilya, use the comments section below or @IlyaSpivak on Twitter


