


AUD/USD Technical Analysis
- Australian Dollar price action against US Dollar
- AUD/USD price chart and analysis
AUD/USD price – Hesitant Traders
Last week, AUD/USD declined to 0.6849 -its lowest level in nearly three weeks. The price rallied after, then closed the weekly candlestick below 0.6900 handle with a 0.7% loss. This week, the pair has traded ineffectively reflecting market’s indecision at this stage.
Alongside this, the relative Strength Index (RSI) remained flat nearby 50 highlighting that buyers were not in control, nor sellers.
Having trouble with your trading strategy? Here’s the #1 Mistake That Traders Make
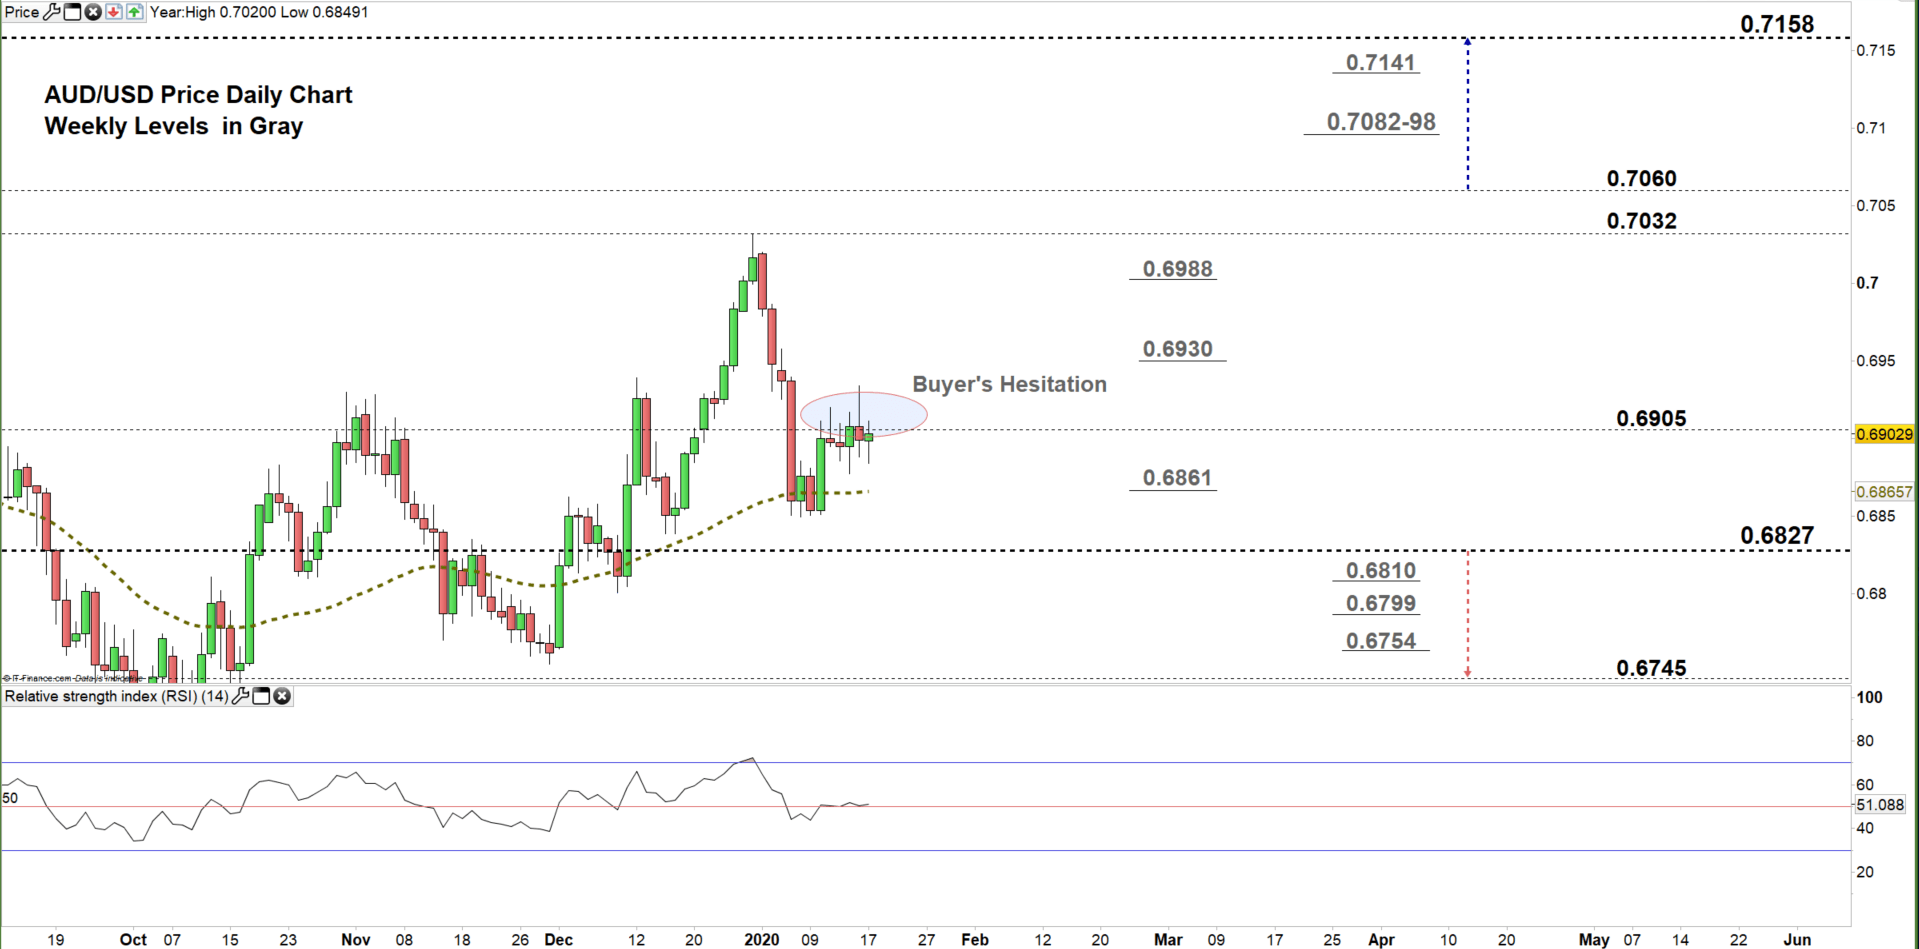
AUD/USD DAILY PRICE CHART (JUNE 15, 2018 – JAn 17, 2019) Zoomed Out

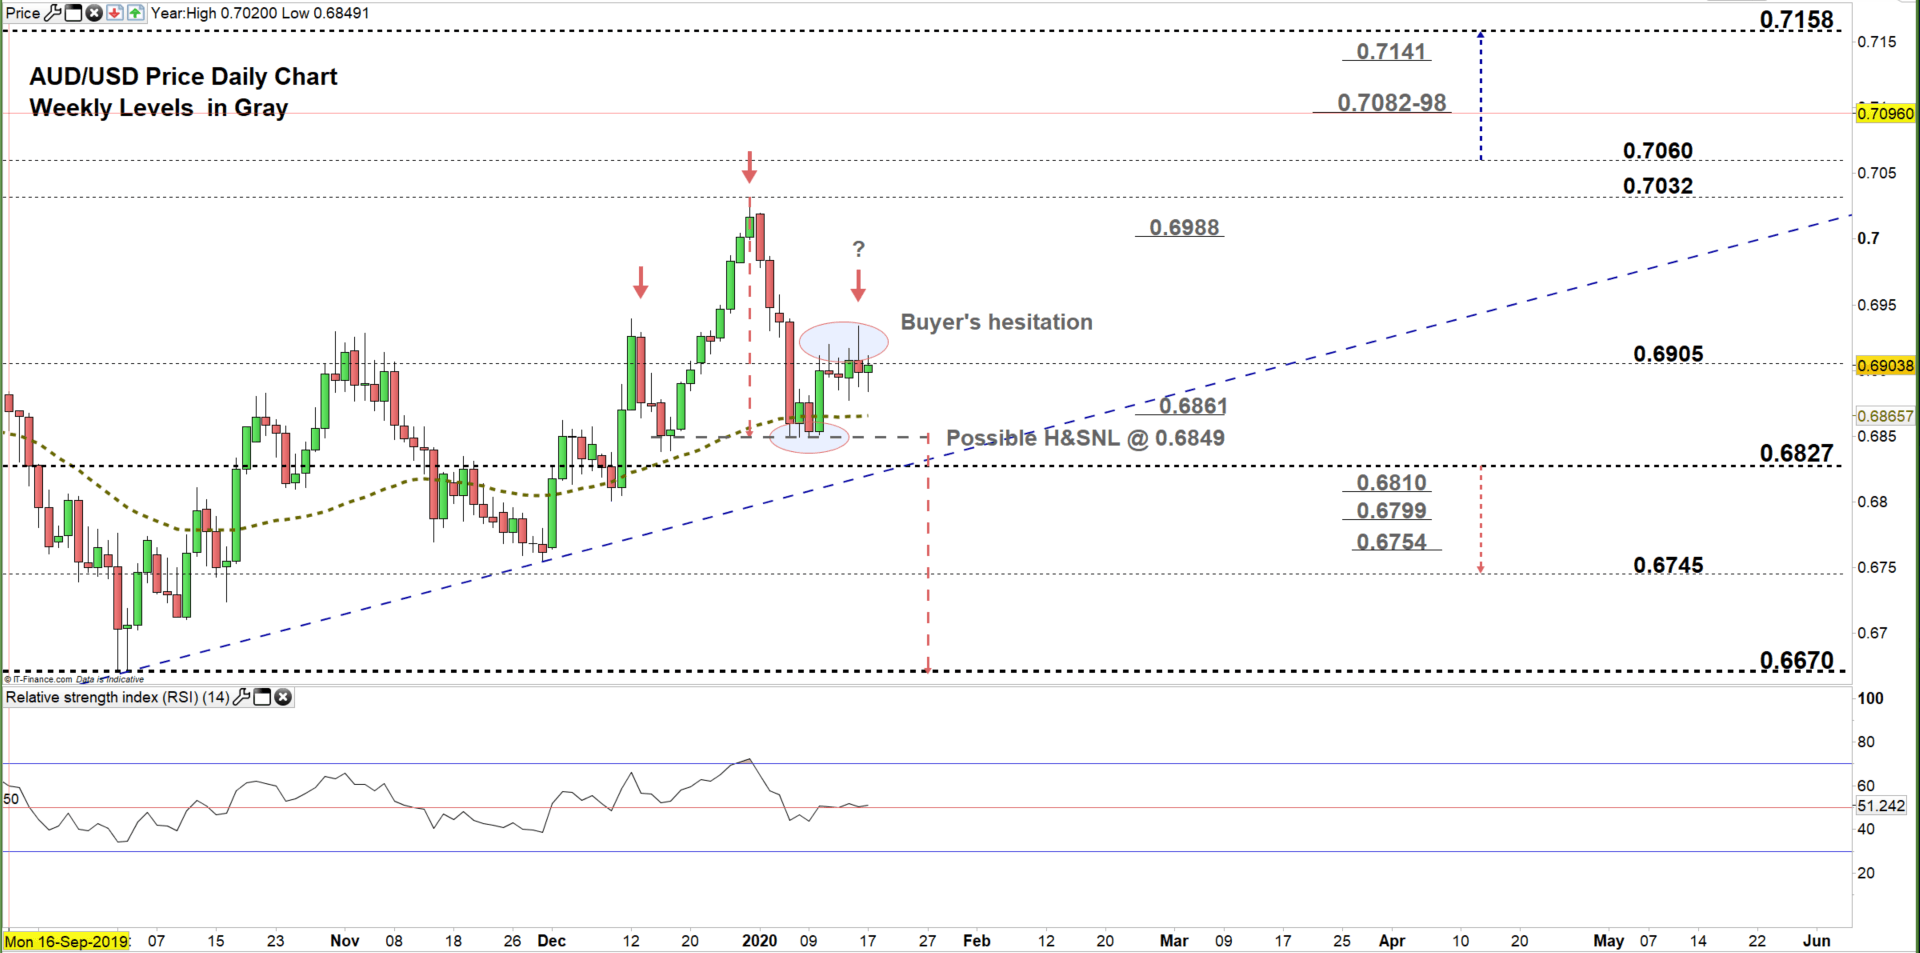
AUD/USD DAILY PRICE CHART (May 31 – JAn 17, 2019) Zoomed IN
Looking at the daily chart, we notice on Jan 7 AUD/USD tumbled to a lower trading zone 0.6827- 0.6905 as some buyer’s pulled back. On Friday, the pair closed above the 50-day average and generated a bullish signal.
This week, buyers rallied the price in multiple occasions above the high end of the zone. However, some of them has been taking profit signaling hesitation.
A close above the high end of the zone may end some buyer’s reluctance. This could push AUD/USD towards 0.7032 contingent on clearing the weekly resistance level underlined on the chart (zoomed in). Further close above 0.7060 could embolden buyers to rally the pair towards 0.7158. In that scenario, the weekly resistance level and area underscored on the chart should be kept in focus.
It’s noteworthy that, the pair could be developing head and shoulders pattern. Any violation to the neckline residing at 0.6849 could send AUDUSD towards 0.6670. That said, the weekly support with the trading zone/s marked on the chart should be considered.

AUD/USD Four-Hour PRICE CHART (Sep 13 – JAn 17, 2019)
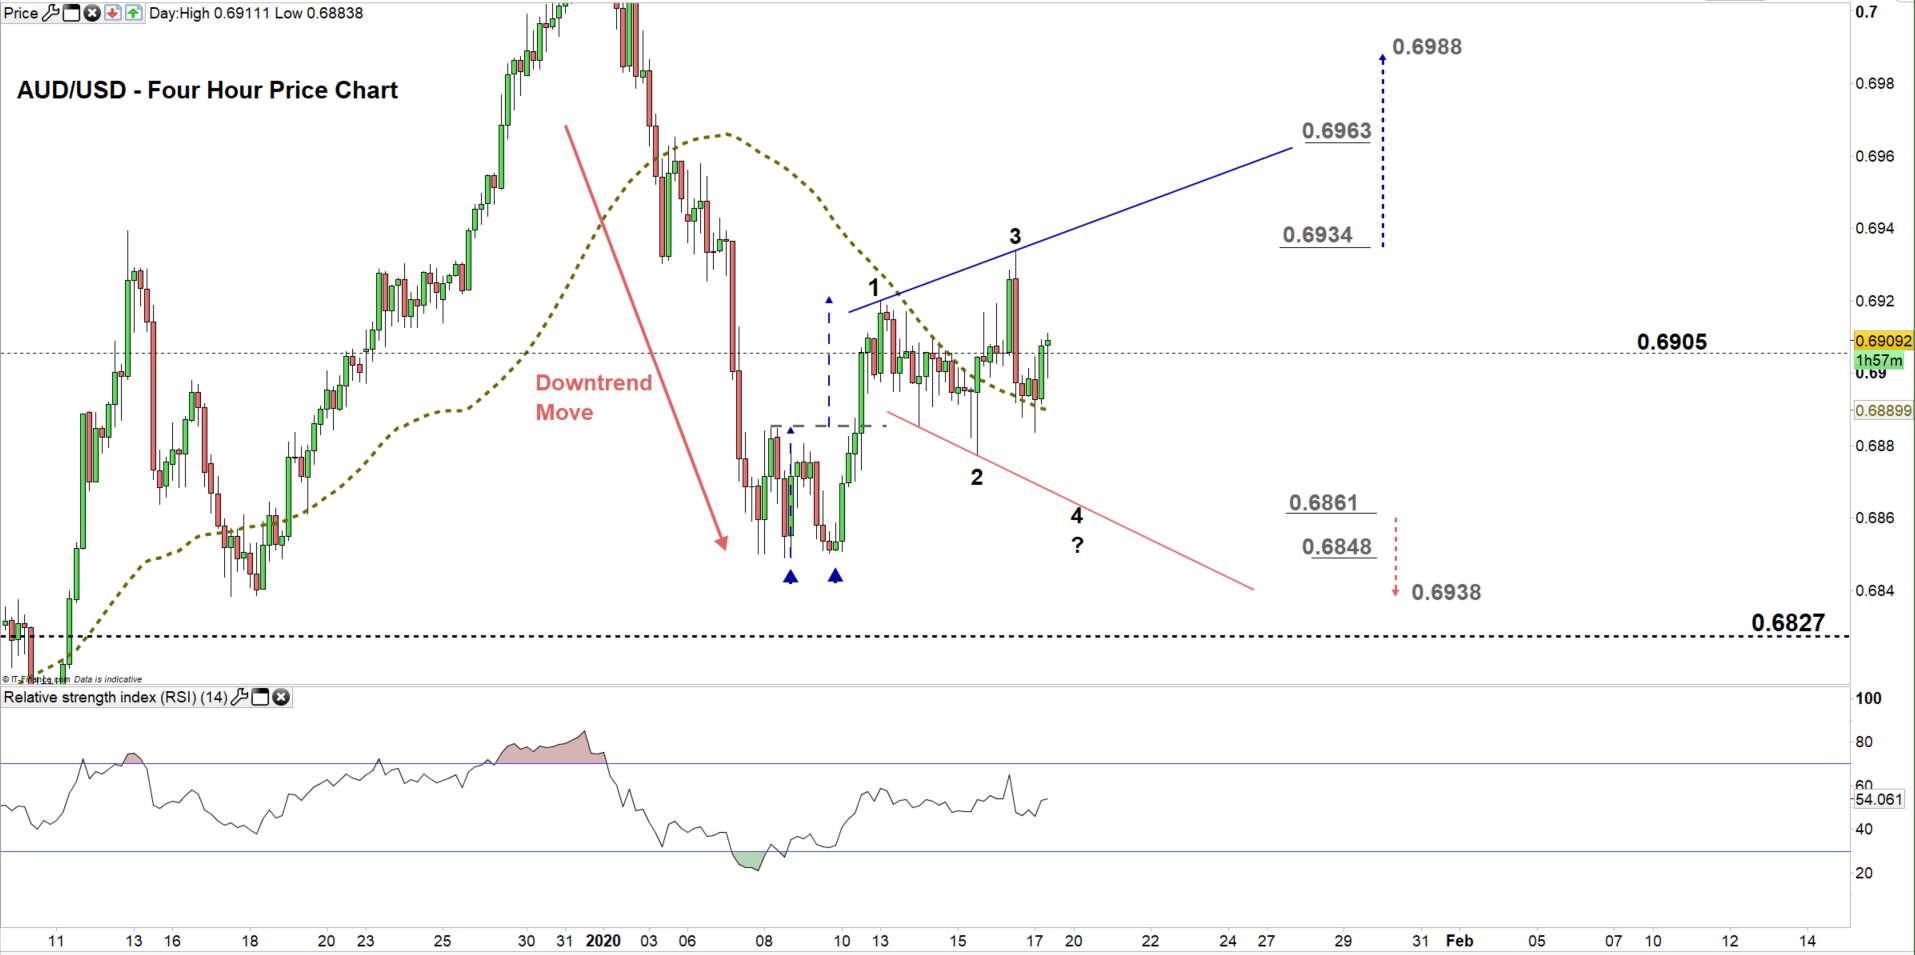
From the four- hour chart, we notice on Dec 31 AUD/USD peaked at 0.7032 then started a downtrend move creating lower highs with lower lows. On Friday, the trend reversed higher after breaking above the neckline of double bottom pattern then hit its target on Monday.
Currently, the pair could be developing a broadening top pattern. This pattern is usually a bearish pattern. A break below 0.6861 could send AUD/USD towards 0.6938. Yet, the daily support level underlined on the chart should be watched closely. On the flip-side, a break above 0.6934 may cause a rally towards 0.6988. Although, the resistance level at 0.6963 should kept in focus.
Having trouble with your trading strategy? Here’s the #1 Mistake That Traders Make
Written By: Mahmoud Alkudsi
Please feel free to contact me on Twitter: @Malkudsi


