


AUD/USD TECHNICAL OUTLOOK: BEARISH
- Aussie Dollar downtrend suffers setback but bearish bias still intact
- Daily close above 0.6930 likely needed to neutralize selling pressure
- Long-term positioning warns a deeper slump looms on the horizon
Get help building confidence in your AUD/USD strategy with our free trading guide!
The Australian Dollar recoiled sharply higher against its US counterpart, erasing half of November’s choppy downward grind in a mere two days. Prices paused to consolidate ahead of resistance in the 0.6865-81 area. This is reinforced by the outer layer of dominant trend resistance set from November 2018 – now at 0.6892. The late-October swing top at 0.6930 follows closely thereafter.
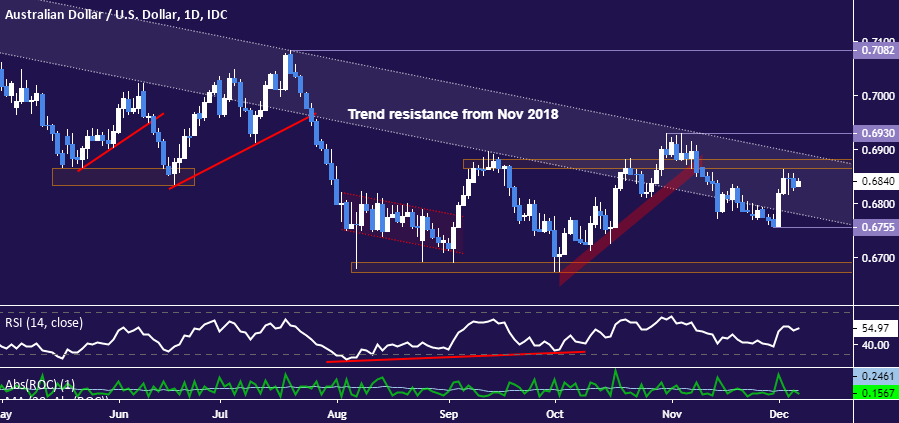
Daily AUD/USD chart created with TradingView
Breaking above the latter barrier on a daily closing basis would suggest that immediate selling pressure has been neutralized, opening the door for a rise to challenge the 0.70 figure. July’s swing top at 0.7082 would be in focus next. Alternatively, a turn lower that brings AUD/USD below the November 29 low at 0.6755 would probably set the stage to probe the 0.6671-90 support shelf once again.
Zooming out to the monthly chart seems to offer some useful context to the choppy nearer-term positioning. It puts the Aussie in a narrow range since August. A bit of digestion seems reasonable enough considering that month marked the break of a four-year support shelf. In fact, a similar consolidative period followed the October 2018 break of 17-year support before its bearish implications were further build upon.
With that in mind, the current period of standstill does not seem to imply that sellers have lost the upper hand, at least not necessarily. Rather, the breach of a key barrier may have beckoned a need to regroup and reassess conviction before the underlying trend is reasserted. In this scenario, a challenge of the 0.6009-0.6352 region may be looming in the months ahead.
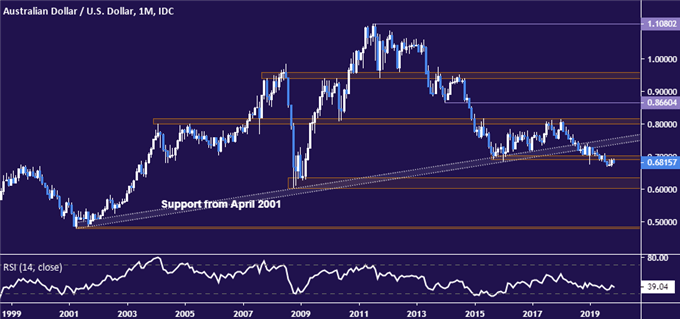
Monthly AUD/USD chart created with TradingView
AUD/USD TRADING RESOURCES
- Just getting started? See our beginners’ guide for FX traders
- Having trouble with your strategy? Here’s the #1 mistake that traders make
- Join a free live webinar and have your trading questions answered
--- Written by Ilya Spivak, Currency Strategist for DailyFX.com
To contact Ilya, use the comments section below or @IlyaSpivak on Twitter


