


AUD/USD, NZD/USD Charts and Analysis
- US Dollar price action against Australian Dollar and New Zealand Dollar.
Did we get it right with our Gold and USD Dollar forecasts? Find out more for free from latest main currencies and commodities forecasts
AUD/USD, NZD/USD – From Bearish to Bullish
On Sep 3, AUD/USD declined to 0.6687- its lowest level in five weeks. However, in the following days the pair rallied and closed the weekly candlestick with nearly 1.7% gain. On the other hand, NZD/USD started to trade higher on Sep 4 then closed on Friday in the green with 1.8% gain.
On Friday, the Relative Strength Index (RSI) climbed to 60 on AUDUSD then remained flat after, indicating to a fading uptrend momentum. Similarly, the oscillator climbed to 51 then remained flat highlighting the same case for NZDUSD.
Having trouble with your trading strategy? Here’s the #1 Mistake That Traders Make
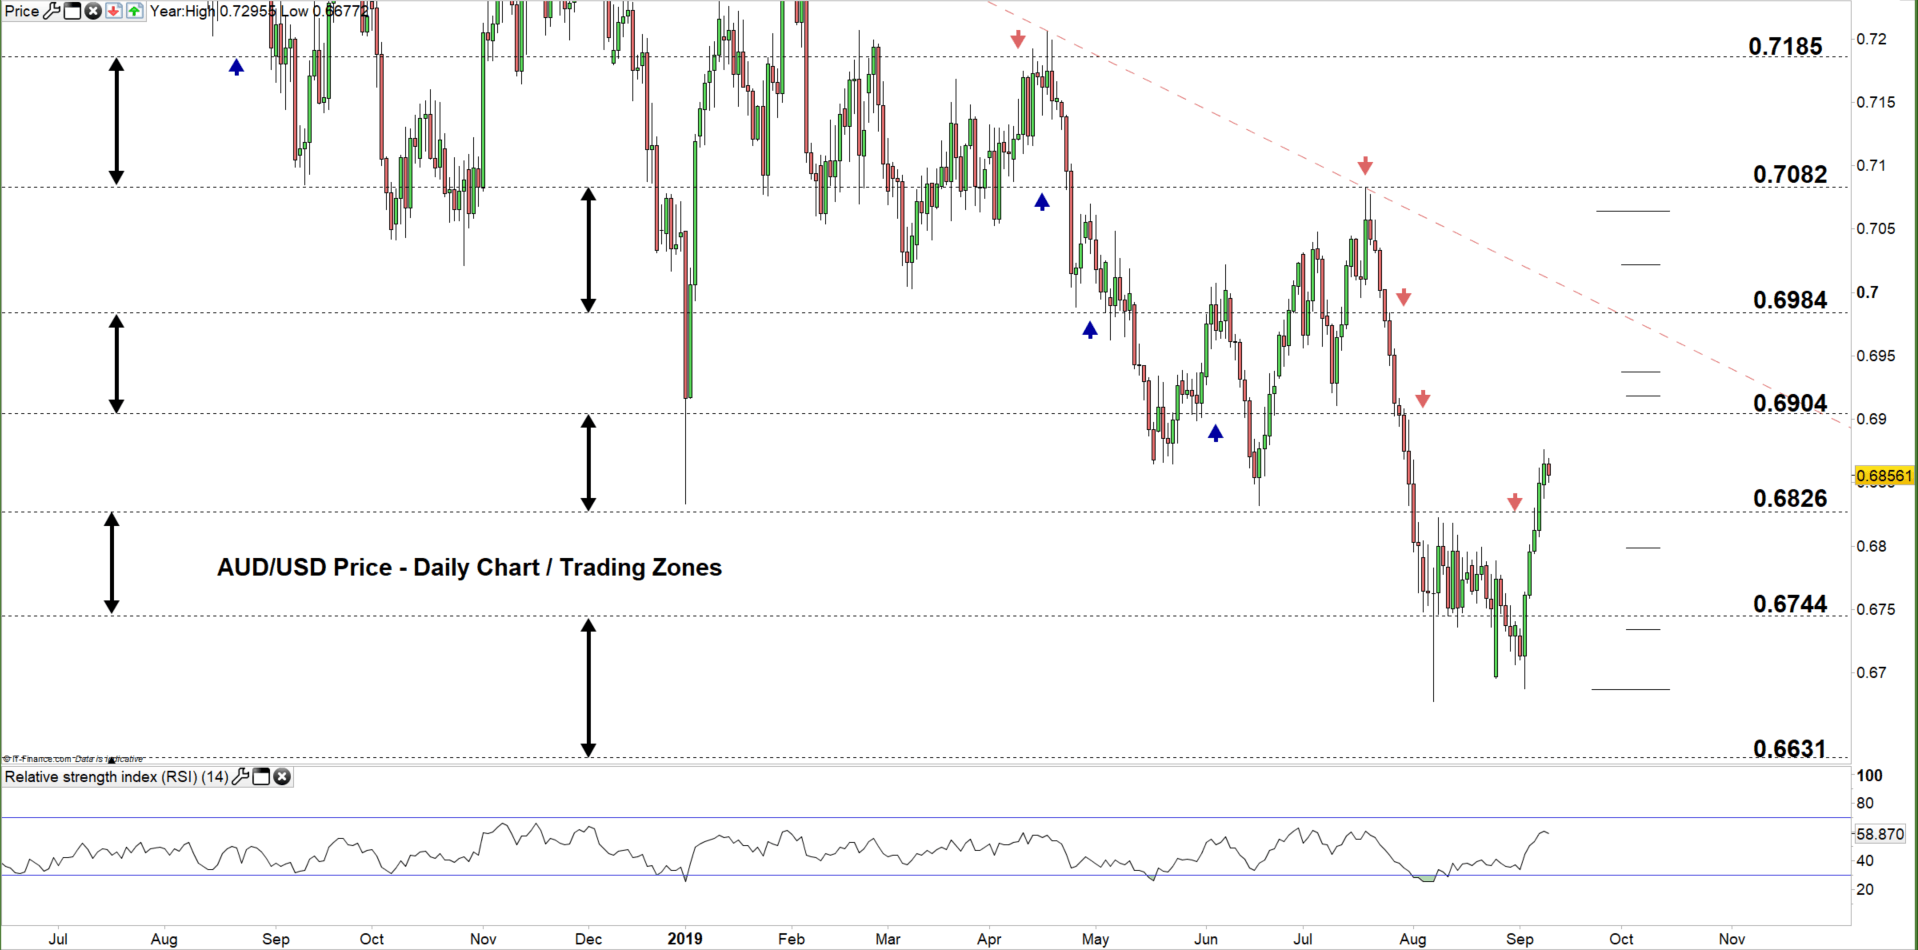
AUD/USD DAILY PRICE CHART (June 15, 2018 – Sep 10, 2019) Zoomed Out
AUD/USD DAILY PRICE CHART (July 4 – Sep 10, 2019) Zoomed IN
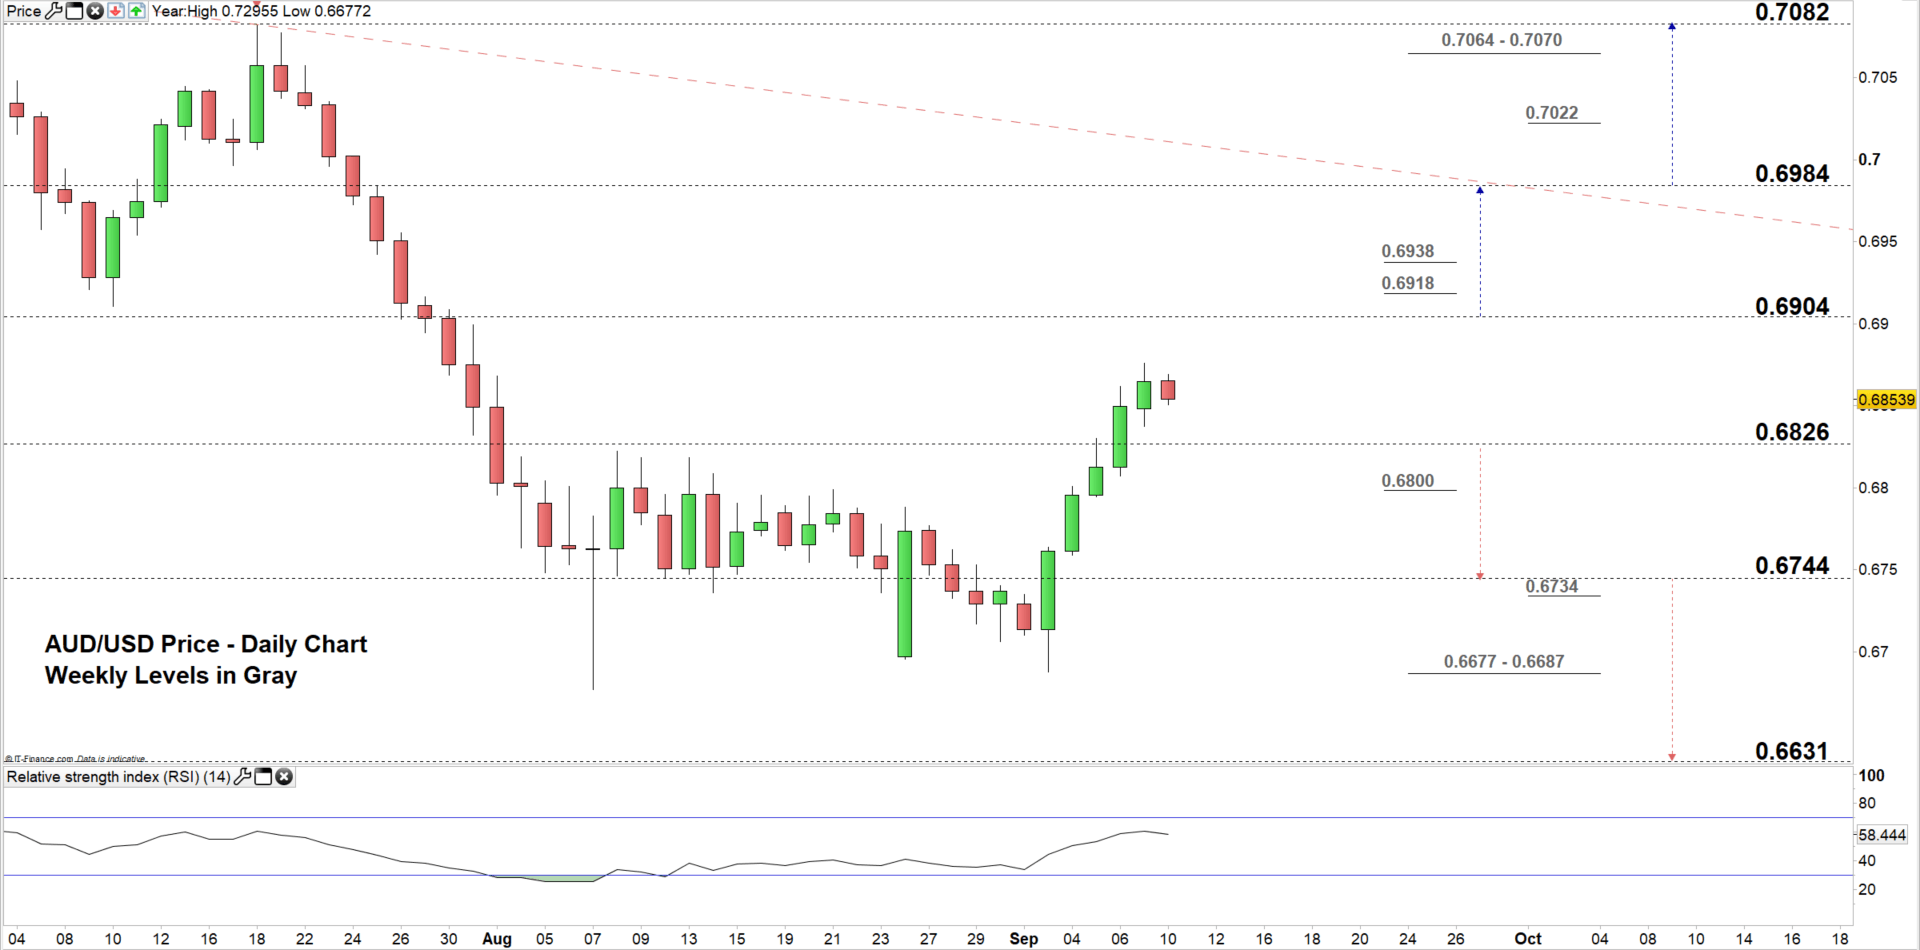
Looking at the daily chart, we notice on Friday AUD/USD rallied to a higher trading zone 0.6826 – 0.6904 eyeing a test of the high end of this zone.
Hence, a close above the high end of the zone could push AUDUSD towards 0.6984. However, the weekly resistance levels underscored on the chart (zoomed in) need to be considered. Further close above 0.6984 may lead the price towards 0.7082. In that scenario, the weekly resistance levels underlined on the chart need to be watched along the way.
On the flip-side, any failure in closing above the high end of the zone could reverse the pair’s direction and send it towards the low end. Further close below the low end might press AUDUSD towards 0.6744. However, the weekly support level and area marked on the chart would be worth monitoring.
Just getting started? See our Beginners’ Guide for FX traders
NZD/USD DAILY PRICE CHART (April 15, 2017 – Sep 10, 2019) Zoomed Out

NZD/USD DAILY PRICE CHART (June 15 - Sep 10, 2019) Zoomed In

From the daily chart, we notice on Friday NZD/USD rebounded then closed below the high end of current trading zone 0.6224 – 0.6438. Same thing happened on Monday, indicating to buyer’s weakness to rally the price further.
Hence, NZDUSD could be on its way for a test of the low end of the zone. Although, the weekly support levels underlined on the chart (zoomed in) should be kept in focus. Further close below 0.6224 could open the door for more bearishness towards 0.5911. That said, sellers need to pay a close attention to the weekly support levels marked on the chart.
On the other hand, any successful close above the high end of the zone, may push NZDUSD towards the vicinity of 0.6565-55 contingent on clearing the weekly resistance levels underscored on the chart.
Written By: Mahmoud Alkudsi
Please feel free to contact me on Twitter: @Malkudsi


