


AUD/USD TECHNICAL OUTLOOK: BEARISH
- Australian Dollar settles into choppy range near early-2019 spike low
- Positive RSI divergence hints a bounce may be ahead, but maybe not
- Actionable trade setup seems missing but trend bias favors weakness
Get help building confidence in your AUD/USD strategy with our free trading guide!
The Australian Dollar is licking its wounds above support at 0.6744, the 2019 spike low, after suffering the longest streak of consecutive losing days in over six years. The plunge followed a break of counter-trend support guiding the upswing from mid-June lows, as expected.
Positive RSI divergence now points to ebbing selling pressure, but that much can be observed in price action itself as AUD/USD oscillates in a choppy range. While this may set the stage for a bounce, it could also amount to little more than consolidation before the selloff resumes.
A daily close above the upper layer of immediate resistance at 0.6865 opens the door for a retest of the minor barrier at 0.6911. Prices would probably need to breach trend resistance set form December 2018 – now at 0.7050 – to truly neutralize immediate selling pressure. A move below 0.6744 eyes 0.6677 next.

AUD/USD chart created with TradingView
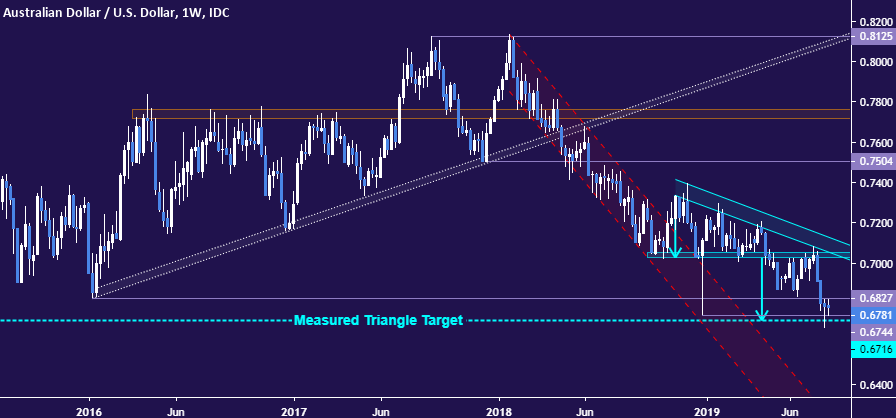
Tactically, an actionable trade setup seems missing for now. Congested near-term positioning appears to make the long and short side unattractive on risk/reward grounds. Stalling after hitting the implied target of the Descending Triangle pattern completed in mid-May begs the question about next steps as well.
AUD/USD chart created with TradingView
With that in mind, markets may well need a nudge from some external catalyst to spur on the next round of trend development. Whenever that occurs however, the path of least resistance seems to lead lower. This implies that any near-term bounce is more likely to be a selling opportunity rather than the alternative.
AUD/USD TRADING RESOURCES
- Just getting started? See our beginners’ guide for FX traders
- Having trouble with your strategy? Here’s the #1 mistake that traders make
- Join a free live webinar and have your trading questions answered
--- Written by Ilya Spivak, Currency Strategist for DailyFX.com
To contact Ilya, use the comments section below or @IlyaSpivak on Twitter


