


AUD/USD Technical Strategy: BEARISH
- Aussie Dollar completes Triangle, hinting 2018 downtrend resuming
- Near-term support at 0.69 but measured objective implied near 0.67
- Break above 0.7133 needed to meaningfully neutralize bearish bias
Get help building confidence in your AUD/USD strategy with our free trading guide!
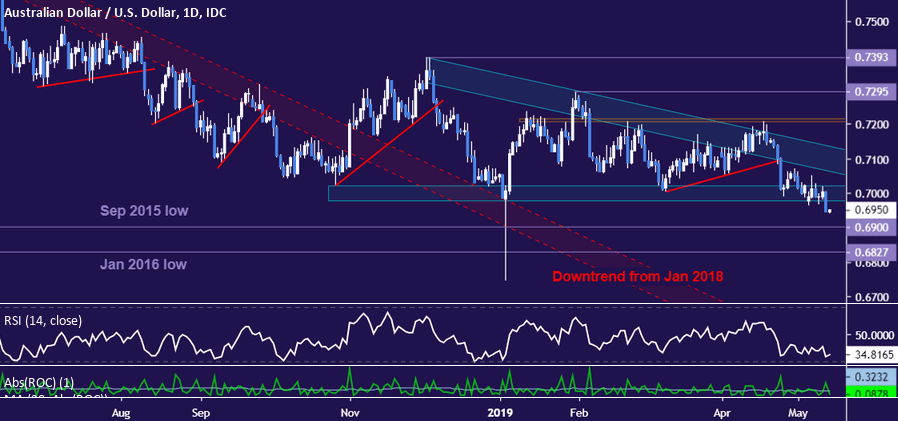
The Australian Dollar appears poised to extend losses against its US counterpart after sellers pushed prices below critical resistance in the 0.6978-0.7021 zone. This marked the floor of a descending Triangle chart pattern carved out since late October 2018. US-China trade war escalation fueled the selloff.
The setup carries bearish implications. Confirmation on a daily close below its lower bound now points to resumption of the downward trend established from January 2018 highs. Initial support is at the 0.69 figure, followed by the January 2016 bottom at 0.6827.
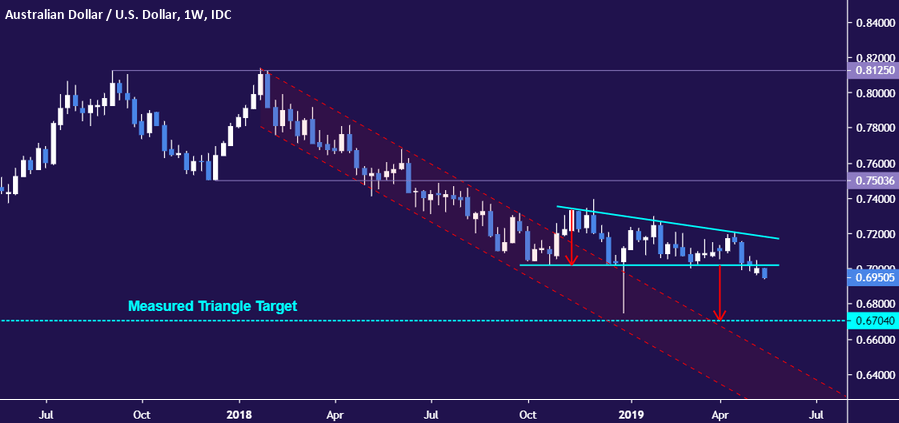
The Triangle formation implies a more substantive decline however. Looking through near-term price swings on the weekly chart, a conservative measuring of the pattern’s height extrapolated downward from the site of the break out calls for a descent to within a hair of the 0.67 figure.
The 0.6978-0.7021 area has been recast as near-term resistance. A reversal back above it puts the Triangle top – a barrier that also establishes the boundaries of the 2019 down trend – back into focus. That is now at 0.7133, with a turn above that opening the door for a test of the 0.7206-15 region.
AUD/USD TRADING RESOURCES
- Just getting started? See our beginners’ guide for FX traders
- Having trouble with your strategy? Here’s the #1 mistake that traders make
- Join a free Trading Q&A webinar and have your questions answered
--- Written by Ilya Spivak, Currency Strategist for DailyFX.com
To contact Ilya, use the comments section below or @IlyaSpivak on Twitter


