


AUDUSD CHART ANALYSIS: BEARISH
- AUDUSD upswing rejected at Triangle floor support-turned-resistance
- Break of upward-sloping support hints dominant downtrend back in play
- Overall positioning suggests a move to decade lows may be in the works
Get help building confidence in your AUDUSD strategy with our free trading guide!
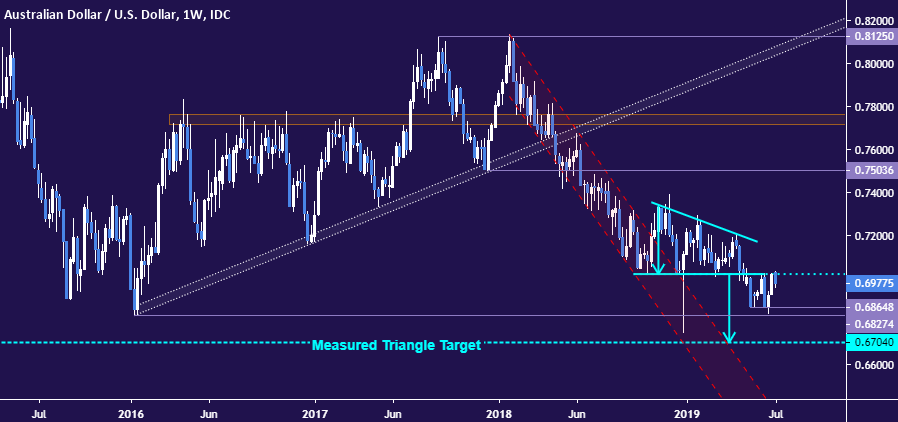
The Australian Dollar recoiled from support-turned-resistance marking the floor of a recently completed Descending Triangle pattern. The chart formation itself carries bearish implications and the prices’ violent rejection on a retest of its parameters seems to reinforce the case for weakness, painting the rise from mid-June lows as corrective in the context of a larger decline.
In fact, prices have now broken support guiding recent gains on a closing basis, imbuing the downside scenario with a sense of urgency. Immediate support lines up in the 0.6827-65 area, the site of recent swing bottoms as well as the January 2016 low. Pushing below that puts the 2019 spike low at 0.6744 in the crosshairs. Invalidating the setup’s bearish likely requires a topside breach of the Triangle top, now at 0.7101.

A still-more ominous picture presents itself upon examining longer-term positioning on the weekly chart. A conservative measuring the Triangle’s implied downside objective by applying the distance at its widest point to the point of breakout suggests a decline to challenge the 0.67 figure is in the works ahead. That would put the Aussie at the lowest in over a decade against its US counterpart.
AUDUSD TRADING RESOURCES
- Just getting started? See our beginners’ guide for FX traders
- Having trouble with your strategy? Here’s the #1 mistake that traders make
- Join a free live webinar and have your trading questions answered
--- Written by Ilya Spivak, Currency Strategist for DailyFX.com
To contact Ilya, use the comments section below or @IlyaSpivak on Twitter


