AUDUSD CHART ANALYSIS: BEARISH
- AUD rebound stalls at key resistance as RBA rate decision looms
- Overall chart setup suggests recent gains corrective, trend bearish
- Invalidating downtrend probably needs a daily close above 0.71
Join our live RBA rate decision webinar to see how it will impact trading AUDUSD!
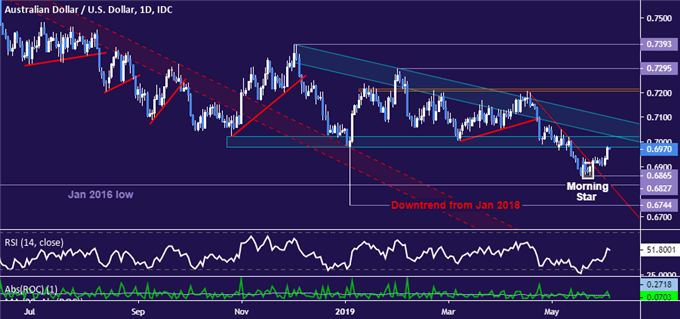
The Australian Dollar traded higher as expected after producing a bullish Morning Star candlestick pattern and breaking near-term trend resistance set from mid-April. Prices are now testing support-turned-resistance marked by the floor of a recently completed Descending Triangle pattern in the 0.6978-7021 area.
As it stands, the rally appears to be corrective in the context of a larger decline started in early January 2018 and resumed with the mid-May Triangle breakout. Invalidating that bearish bias probably calls for a daily close above falling trend line resistance (and Triangle top) set from December, now at the 0.71 figure.

Having said that, an actionable short trade signal appears to be absent for now. If a reversal does materialize, sellers face initial support in the 0.6827-65 area (January 2016 low, May swing bottom). Beyond that is the 2019 spike low at 0.6744.
AUDUSD TRADING RESOURCES
- Just getting started? See our beginners’ guide for FX traders
- Having trouble with your strategy? Here’s the #1 mistake that traders make
- Join a free live webinar and have your trading questions answered
--- Written by Ilya Spivak, Currency Strategist for DailyFX.com
To contact Ilya, use the comments section below or @IlyaSpivak on Twitter


