


Daily
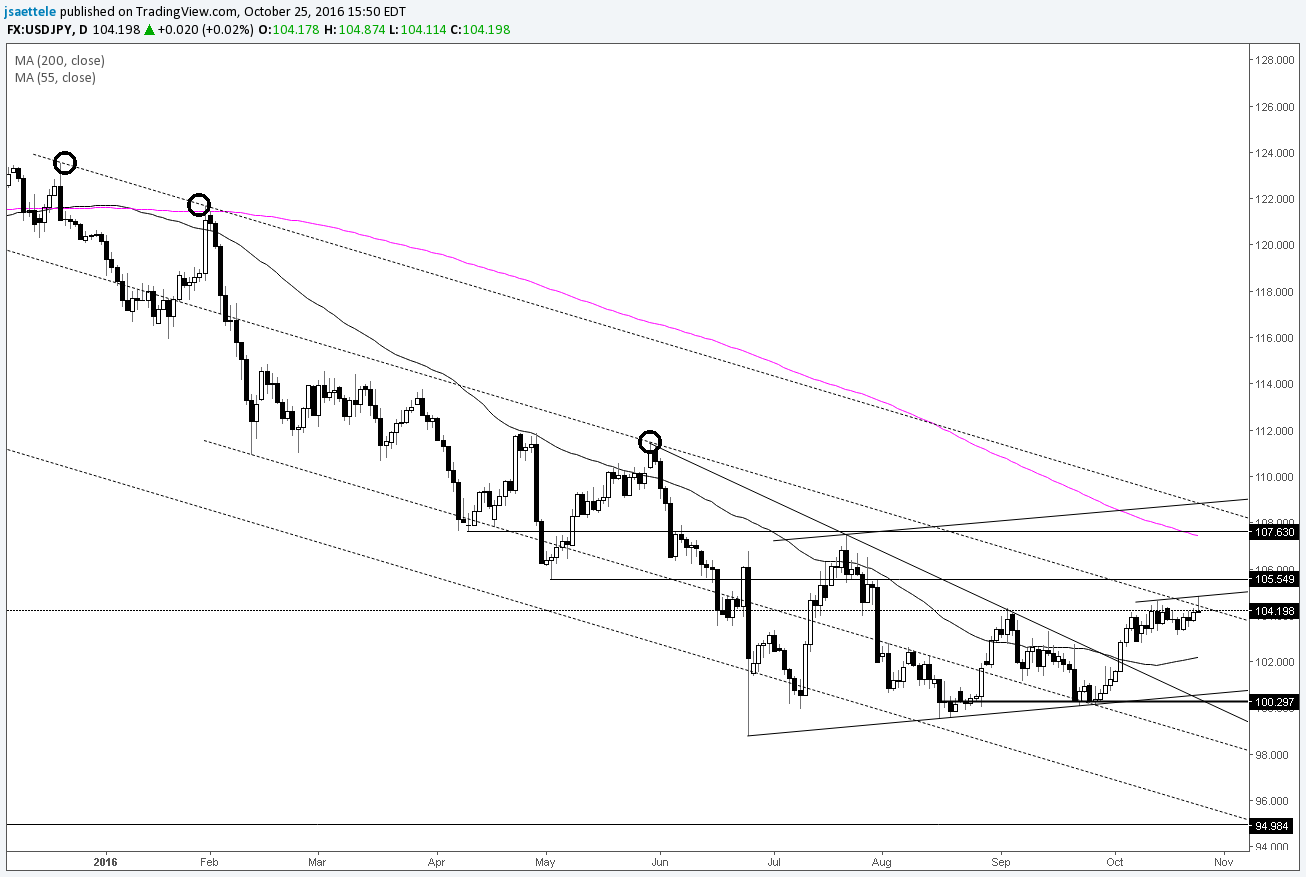
Chart Prepared by Jamie Saettele, CMT
DailyFX Trading Guides and Forecasts
-Price action since the June low (Brexit) could end up as a triangle before another leg lower unfolds. Even so, a horizontal level on the chart to pay attention to is the May low at 105.55. A close above that price would be seen as evidence of a broader structural shift in which case focus would shift towards the 200 day average and July high near 107.50.
For more analysis and trade setups (exact entry and exit), visit SB Trade Desk


