


Daily
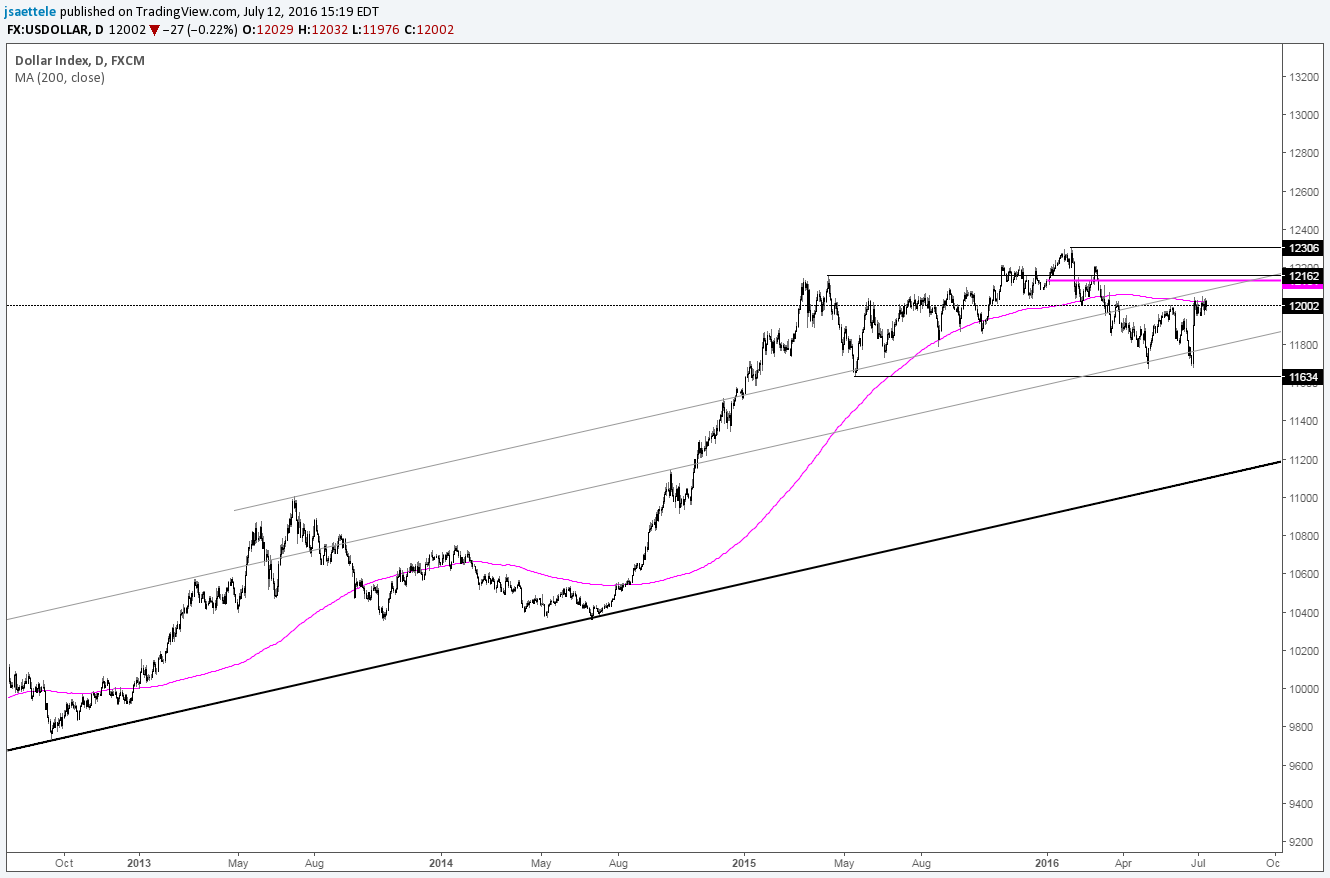
Chart Prepared by Jamie Saettele, CMT
DailyFX Trading Guides and Forecasts
-There is no change to the analysis of the USDOLLAR index, which is ‘stuck’ in a tight range. “Despite the surge post Brexit, price action since March 2015 may compose a major top. Resistance extends up to the year open at 12131 and April 2015 high at 12162 although the rally could derail before then given the presence of the 200 day average, which is being tested now.”
For more analysis and trade setups (exact entry and exit), visit SB Trade Desk


