Skip to Content
News & Analysis at your fingertips.

We use a range of cookies to give you the best possible browsing experience. By continuing to use this website, you agree to our use of cookies.
You can learn more about our cookie policy here, or by following the link at the bottom of any page on our site. See our updated Privacy Policy here.

Free Trading Guides
Subscribe
Please try again
Select

Live Webinar Events

0

Economic Calendar Events

0

Notify me about

Live Webinar Events
Economic Calendar Events

H

High

M

Medium

L

Low
More View More
USDOLLAR Breaks Out to 13 Year High

USDOLLAR Breaks Out to 13 Year High

Jamie Saettele, CMT, Sr. Technical Strategist

Share:

Daily

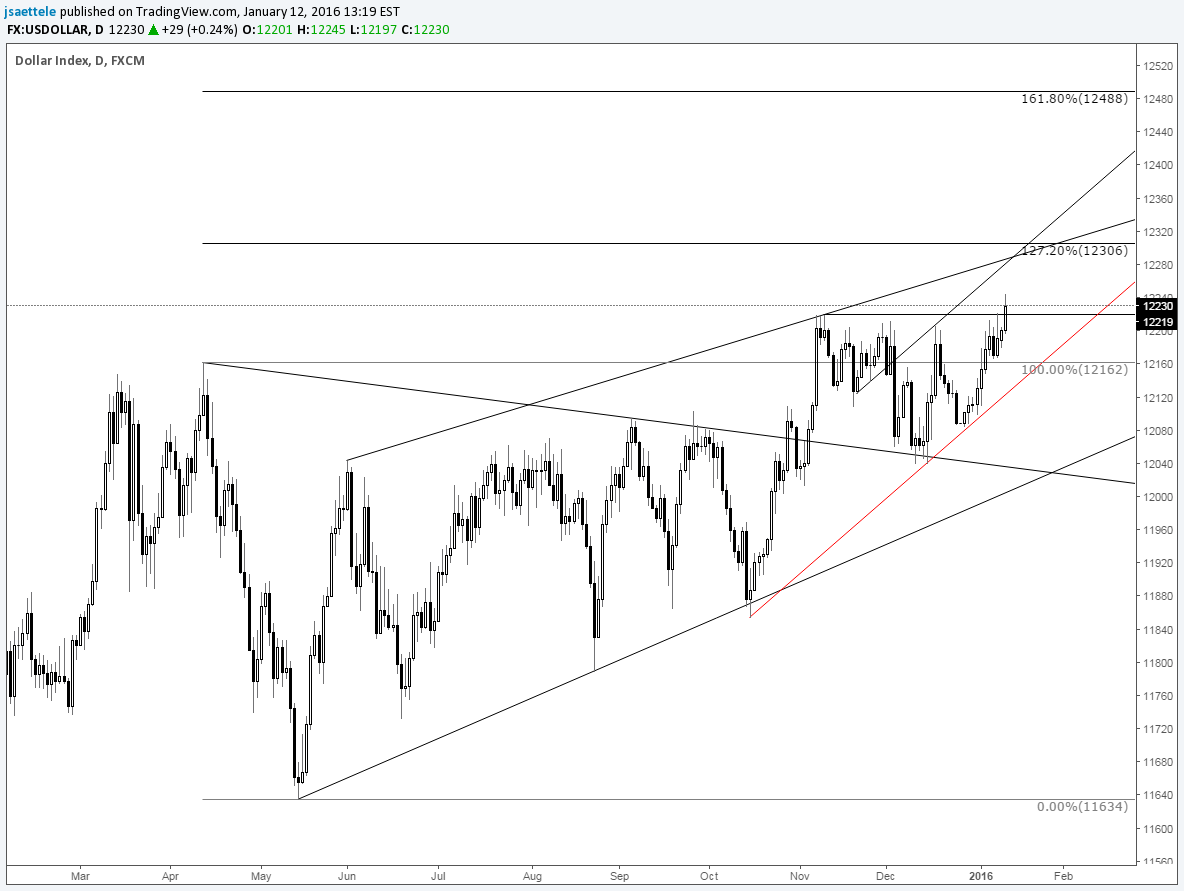
Chart Prepared by Jamie Saettele, CMT

Automate trades with Mirror Trader and see ideas on other USD crosses

-The last update noted that “the USDOLLAR is a mess right now. The November breakout proved false. Weakness in early December was in line with seasonal tendencies but former triangle resistance provided support. In short, conflicting signals abound (uptrend weakening but still an uptrend) but focus is higher while above the December low.” The index broke out of a 2 month inverse head and shoulders continuation pattern today (1/12). The trend is higher as long as above trendline support (red line) but 12280-12300 may slow the advance.

For more analysis and trade setups (exact entry and exit), visit SB Trade Desk

DailyFX provides forex news and technical analysis on the trends that influence the global currency markets.

DISCLOSURES