


Daily
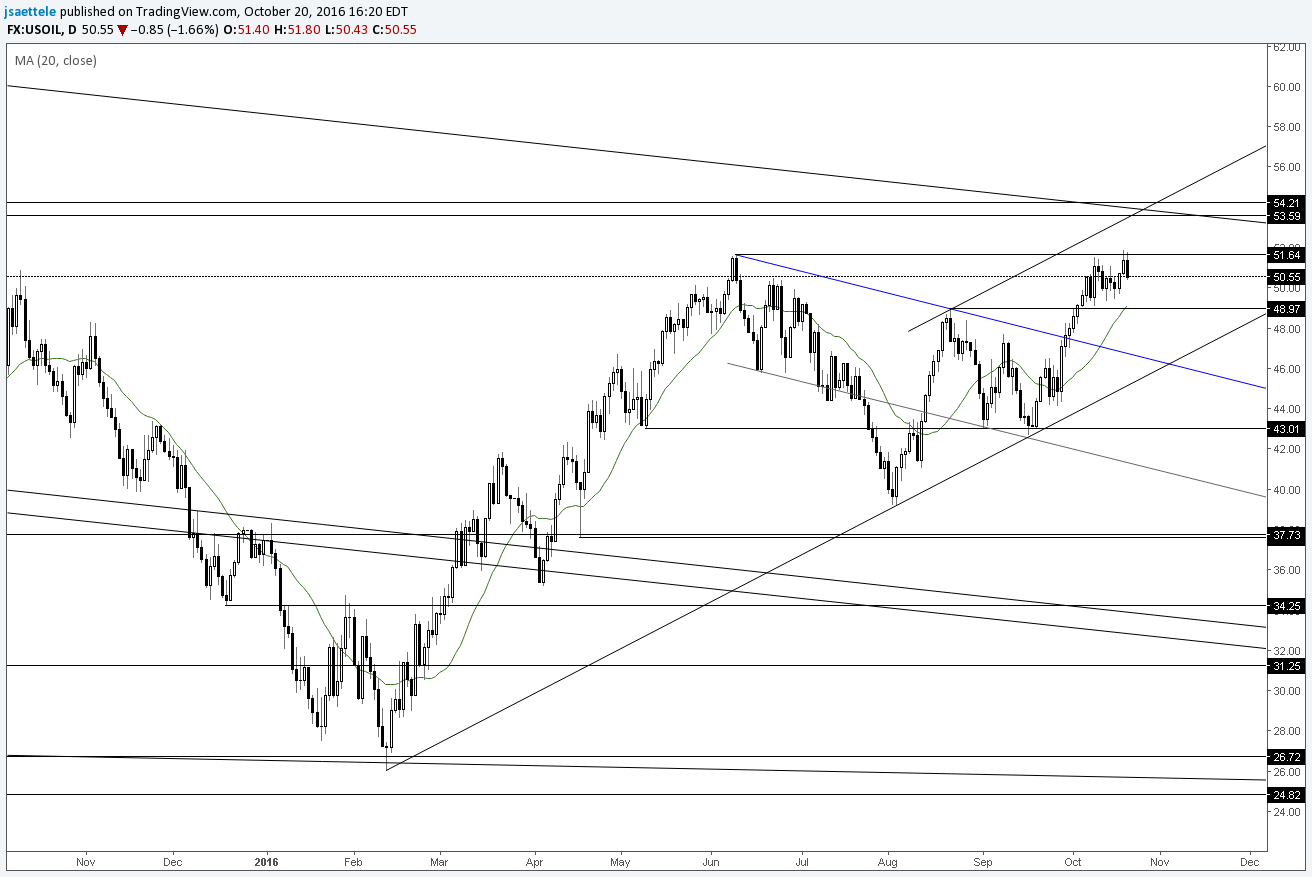
Chart Prepared by Jamie Saettele, CMT
DailyFX Trading Guides and Forecasts
-The possible yearlong head and shoulders pattern (lows in August 2015, February 2016 and August 2016) is intriguing but crude just printed a YTD high and pulled back sharply. Watch for support at 49 (former high and 20 day average) but failure to hold that level risks a drop into the former support line (in blue) near 46.


