


Daily
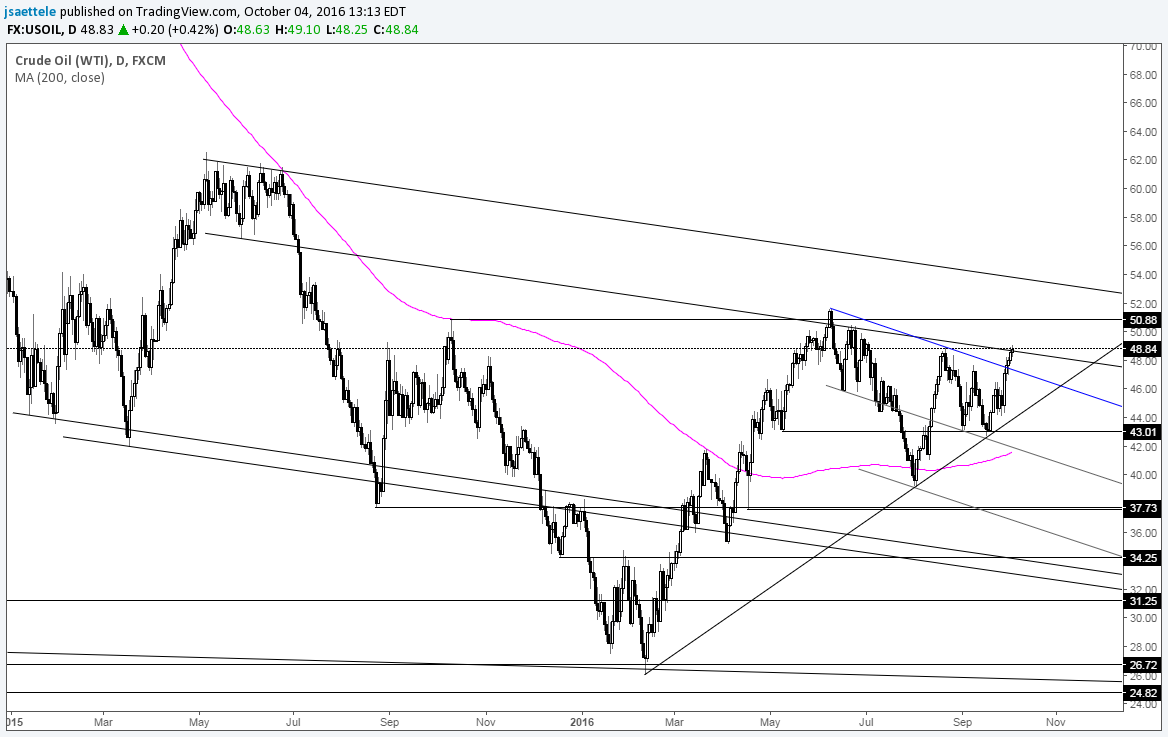
Chart Prepared by Jamie Saettele, CMT
DailyFX Trading Guides and Forecasts
-The possible yearlong head and shoulders pattern (lows in August 2015, February 2016 and August 2016) is intriguing. I wrote last update that “near term momentum is promising (4 hour RSI held 40 on recent declines). Be aware that longer term slope considerations stretch into 49.” 49 is being tested now. If crude is a bull now then 47.30 (top side of breakout level) should hold as support if reached.


