


Daily
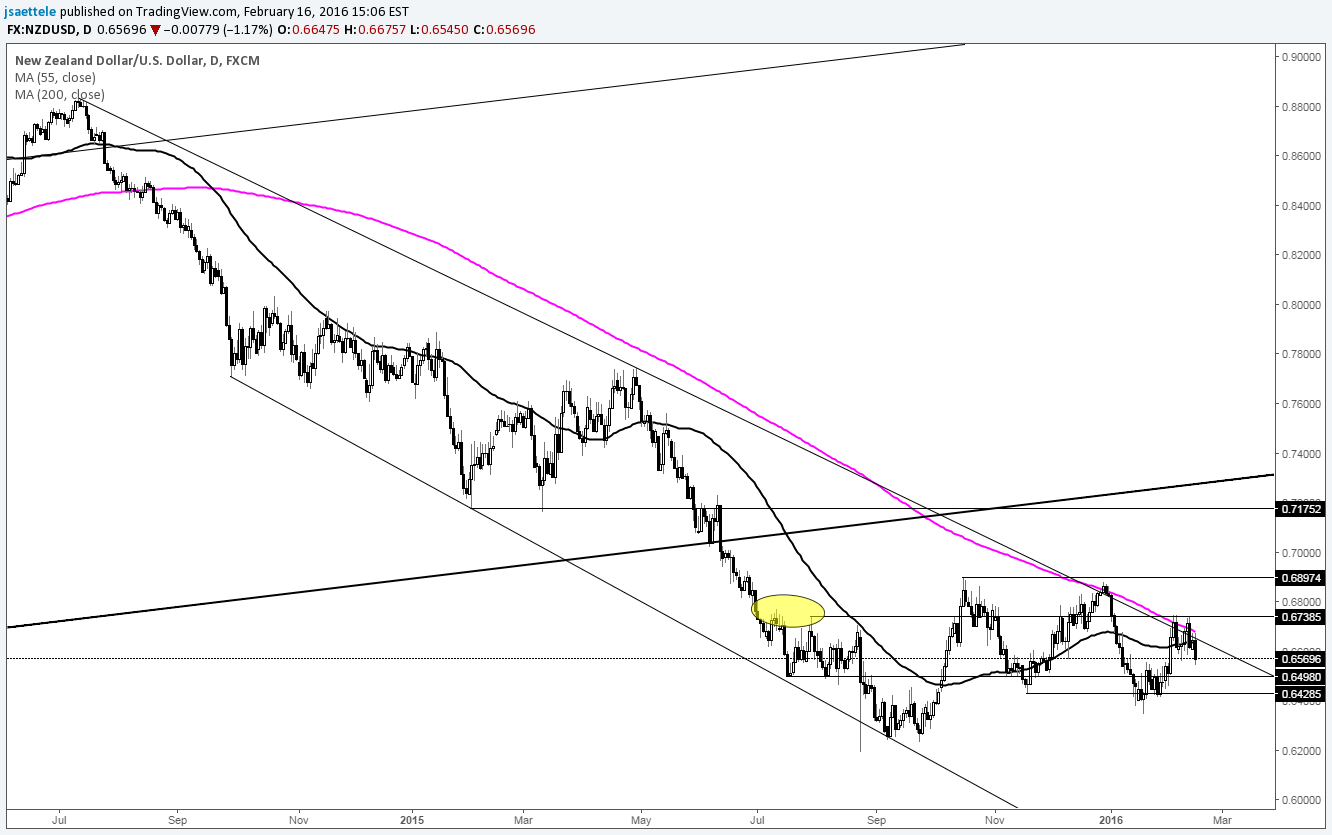
Chart Prepared by Jamie Saettele, CMT
DailyFX Trading Guides and Forecasts
-Since reversing on 1/20, NZD/USD has retraced most of its early year decline. The rally and sideways trade since September can be interpreted as waves A and B or 1 and 2 within a new bullish cycle. That said, a prolonged period of sideways trading (in the event that trade since October is a B wave) is a possibility. Either way, last week’s high (post NFP high), defined by the 200 day average and long term trendline, is significant (important behavior change would take place on a rally through that level).
For more analysis and trade setups (exact entry and exit), visit SB Trade Desk


