Skip to Content
News & Analysis at your fingertips.

We use a range of cookies to give you the best possible browsing experience. By continuing to use this website, you agree to our use of cookies.
You can learn more about our cookie policy here, or by following the link at the bottom of any page on our site. See our updated Privacy Policy here.

Free Trading Guides
Subscribe
Please try again
Select

Live Webinar Events

0

Economic Calendar Events

0

Notify me about

Live Webinar Events
Economic Calendar Events

H

High

M

Medium

L

Low
More View More
EUR/USD Slips Under 200 Day Average; Still above Brexit Low

EUR/USD Slips Under 200 Day Average; Still above Brexit Low

Jamie Saettele, CMT, Sr. Technical Strategist

Share:

Daily

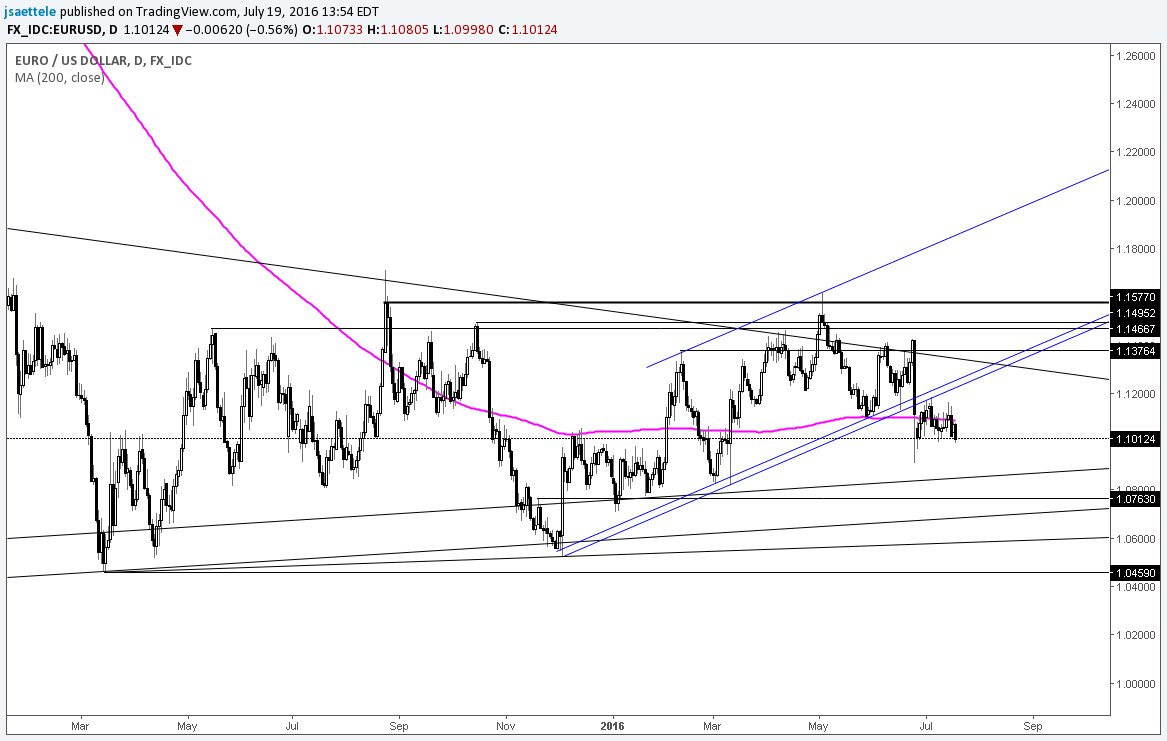
Chart Prepared by Jamie Saettele, CMT

DailyFX Trading Guides and Forecasts

High Frequency Trading Ideas

-EUR/USD has been trading in a range since March 2015. This is one of the longest ranges (defined as length of time since a 52 week closing high or low) on record. I wrote several weeks ago that “if the move is lower then former channel support is probably resistance (blue lines).” That line was resistance but EURUSD has done nothing since then. Of course, the market has its own schedule. An SSI flip to positive did take place today (7/19), which indicates potential for extended weakness. Price has been trading around a flat 200 day average for some time in what’s indicative of a ‘trendless’ market so a ‘move’ is due.

For more analysis and trade setups (exact entry and exit), visit SB Trade Desk

DailyFX provides forex news and technical analysis on the trends that influence the global currency markets.

DISCLOSURES