


Japanese Yen, USD/JPY, US Dollar, EUR/JPY, Euro - Talking Points
- USD/JPY tested technical resistance, but official intervention might be lurking
- EUR/JPY has set-up for some range trading, but a breakout could be imminent
- If the Yen resumes weakening, how high will USD/JPY and EUR/JPY get to?
Introduction to Technical Analysis
Learn Technical Analysis
Recommended by Daniel McCarthy
USD/JPY
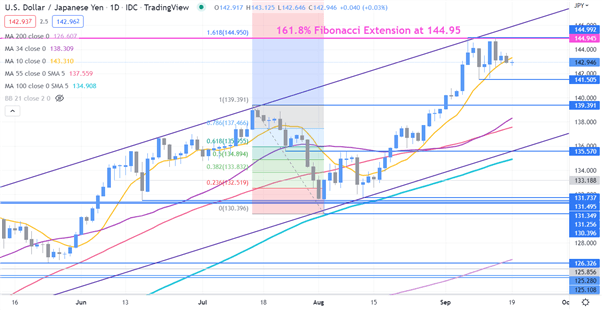
USD/JPY remains in an ascending trend channel after failing to break above 145.
144.95 may continue to offer resistance as it is the 161.8% Fibonacci Extension of the late July pullback from 139.39 to 130.39.
It has been tested a few times recently with peaks at 144.97 and 144.99, the latter is a 24-year high. This area could be pivotal for the next big move in USD/JPY.
On the approach to 145 last week, the Bank of Japan made calls to banks in Tokyo asking for a rate check. This has been interpreted by the market to imply that the central bank could be looking to intervene should the price get above 145.
Of course, in the event that they do not intervene if the price trades above there, an aggressive move might be seen. The ascending trend line that currently dissects at 145.90 could be the next potential resistance level to monitor.
The low since the peak at 141.50 may provide support and has provided the base of the 2-week range of 141.50 – 145. A break of this consolidating range might provide a directional indicator.

EUR/JPY
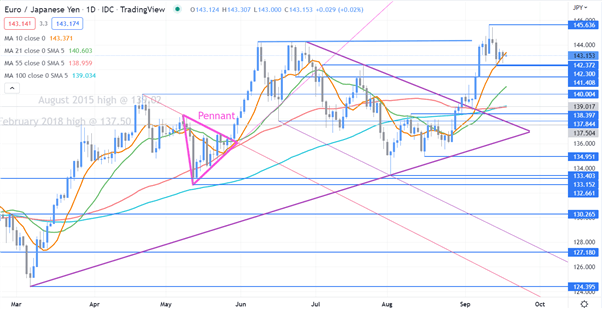
EUR/JPY broke the topside of a Pennant Formation in late August and went on to make an 8-year high at 145.65. That level may offer resistance.
Nearby support may lie at the break points of 142.37 and 141.41 or the recent low of 142.30. Further down support might be provided at the break points of 141.41 and 140.00 or the prior lows of 134.95, 133.40 and 132.66.
The price has dropped below the 10-day day simple moving average (SMA) but remains well clear of all other period SMAs that are displaying positive gradients.
This could suggest that near term momentum is stagnant but underlying bullish momentum persists for now. A break of the 2-week range of 142.30 – 145.65 may see momentum build in that direction.
Introduction to Technical Analysis
Candlestick Patterns
Recommended by Daniel McCarthy
--- Written by Daniel McCarthy, Strategist for DailyFX.com
To contact Daniel, use the comments section below or @DanMcCathyFX on Twitter


