


Japanese Yen, USD/JPY, IG Client Sentiment – Technical Forecast
- Japanese Yen showing early signs of resistance against the US Dollar
- USD/JPY is still arguably in an uptrend looking at the 4-hour setting
- Retail traders continue boosting short exposure, likely a bullish signal

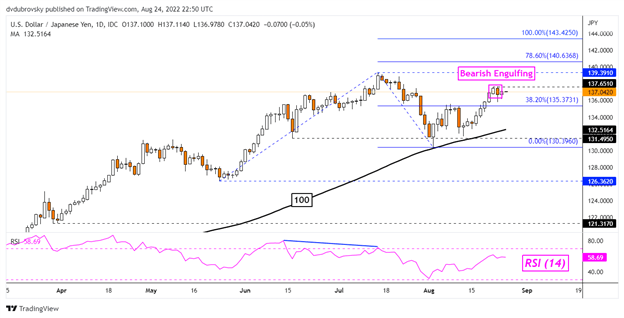
USD/JPY Technical Analysis – Daily Chart
Following a rough period in July, the US Dollar has been slowly regaining its footing against the Japanese Yen. Last week was the best for USD/JPY (+2.58%) since early June. Now, it seems the pair is establishing resistance around 137.65. This does not necessarily mean that a reversal might be upon us, but rather something that traders might want to watch closely.
A Bearish Engulfing candlestick pattern was also left behind earlier this week, but downside confirmation has been lacking. Immediate support appears to be the 38.2% Fibonacci extension at 135.37. A breakout under this price could open the door to extending losses. That would subsequently place the focus on the 100-day Simple Moving Average (SMA).
The latter could still hold as key support, reinstating what has been the dominant uptrend since the beginning of 2021. Further gains would expose the July high at 139.39 where USD/JPY will have a chance to resume the uptrend. Such an outcome would expose the 78.6% and 100% extensions at 140.63 and 143.42 respectively.

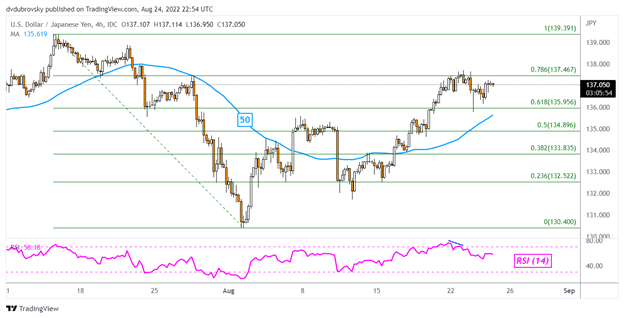
4-Hour Chart
Zooming in on the 4-hour chart can give us a better idea of how resistance is shaping up. Taking a Fibonacci retracement of the July move, we can see that prices were unable to pierce the 78.6% level at 137.46. Even so, the 50-period SMA is still below USD/JPY. This shows that the uptrend since August remains in play. Clearing this line could open the door to a near-term reversal. In such an outcome, keep a close eye on the midpoint, 38.2% and 23.6% levels at 134.89, 133.83 and 132.52 respectively. Further losses would place the focus on the August low at 130.40.
USD/JPY Sentiment Outlook - Bullish
The IG Client Sentiment gauge (IGCS) shows that about 26.13% of retail traders are net-long USD/JPY. IGCS tends to function as a contrarian indicator. Since the vast majority of investors are leaning short on the exchange rate, this seems to suggest that prices may continue rising. This is as downside exposure increased by 7.34% and 15.30% compared to yesterday and last week respectively. With that in mind, the combination of current and recent shifts in sentiment is producing a stronger bullish contrarian bias.
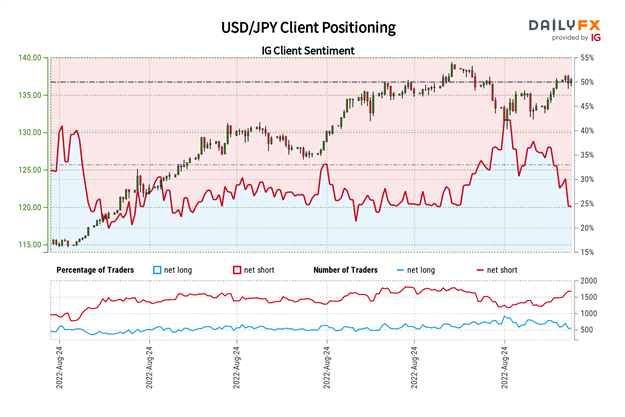
*IG Client Sentiment Charts and Positioning Data Used from August 24th Report
--- Written by Daniel Dubrovsky, Strategist for DailyFX.com
To contact Daniel, use the comments section below or @ddubrovskyFX on Twitter


