


Japanese Yen, USD/JPY, US Dollar, EUR/JPY, Euro - Talking Points
- USD/JPY has bounced off the recent low, but resistance may lie ahead
- EUR/JPY appears to be caught in a descending trend despite the recent rally
- If the Yen weakening picks up, will USD/JPY and EUR/JPY make historic highs?
Introduction to Technical Analysis
Learn Technical Analysis
Recommended by Daniel McCarthy
USD/JPY
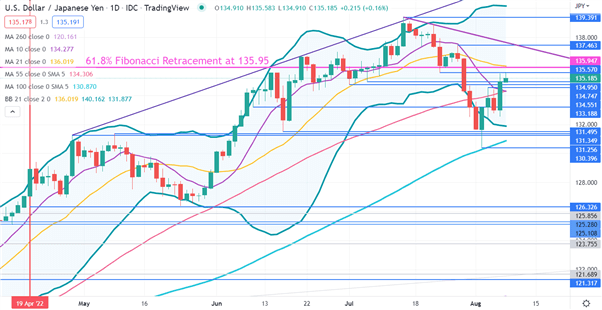
USD/JPY made a 2-month low last week at 130.40 and the move went below several support levels in the 131.25 – 131.50 area.
The price was unable to close below these levels and was not able to sustain the push lower. This could be viewed as a rejection of the break lower and that area could provide support if tested again.
On that move, it went below the lower band of the 21-day simple moving average (SMA) based Bollinger Band. Once it closed back inside the band, it rallied toward the break point of 135.57, but was unable to overcome it and it may continue to offer resistance.
The widening of the bands themselves indicates an increase in volatility in the recent price action.
Just above there, the 61.8% Fibonacci retracement level of the move from the 24-year high at 139.39 to last weeks low of 130.40 is at 135.95. It might offer resistance as well as the late July peak of 137.46 that has a descending trend line currently intersecting near it.
USD/JPY CHART

EUR/JPY
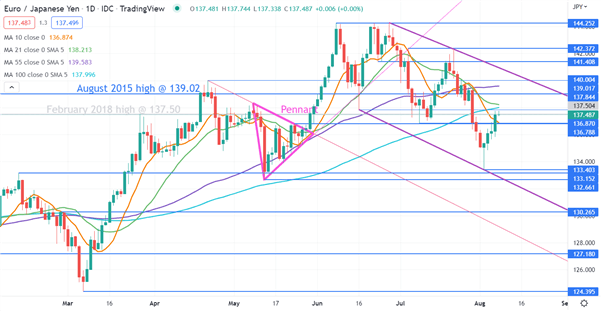
EUR/JPY made a 3-month low last week at 133.40, which is just above a break point of 133.15 and the May low of 132.66. These levels may provide support if tested again.
The price remains in an overall descending trend channel and is below all period simple moving averages (SMA) with the exception of the 10-day SMA. This may suggest that there is a pause in bearish momentum, but that underlying medium and long-term bearish momentum may still be evolving.
The 21- and 100-day SMAs are currently clustered in the 138.00 – 138.20 zone and might offer resistance. The break point at 141.41 and the mid-July peak of 143.12 may also offer resistance.
Further up, the triple top at the 7-year high of 144.28 could offer resistance.
EUR/JPY CHART
Introduction to Technical Analysis
Candlestick Patterns
Recommended by Daniel McCarthy
--- Written by Daniel McCarthy, Strategist for DailyFX.com
To contact Daniel, use the comments section below or @DanMcCathyFX on Twitter


