


Japanese Yen, USD/JPY, US Dollar, Bolling Band, Momentum- Talking Points
- USD/JPY has rallied since making a 2-month low but faces resistance
- Increasing volatility has seen wide daily ranges as uncertainty plays out
- If bullish momentum returns to USD/JPY, will it print a new 24-year high?
Introduction to Technical Analysis
Learn Technical Analysis
Recommended by Daniel McCarthy
USD/JPY
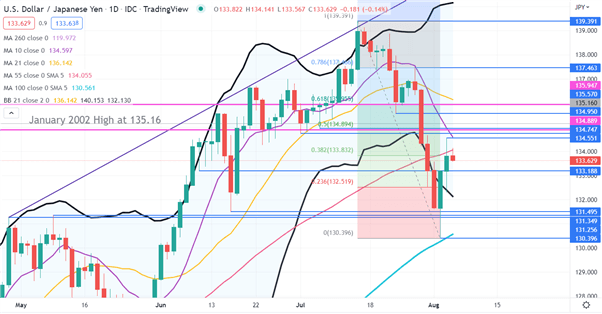
After last week’s Federal Open Market Committee (FOMC) meeting, USD/JPY accelerated it’s move lower from the 24-year high made in July.
On that move, it went below the lower band of the 21-day simple moving average (SMA) based Bollinger Band. It has since closed back inside the band.
When the price moved outside the upper Bollinger Band in July and then closed back inside the band, it marked the top of that bullish run.
The price closing back inside the lower band may signal an exhaustion of the bearish run. It should be noted though that past performance is not indicative of future results.
The widening of the bands themselves indicates an increase in volatility in the recent price action.

Potential resistance could be at 61.8% Fibonacci retracement level at 135.95 or a break point at 135.57. That Fib retracement is from the mid-July high of 139.40 to Tuesday’s low of 130.40.
Below there, a possible resistance zone might be in the 134.75 – 134.95 area. There are 2 break points at 134.75 and 134.95, as well as a 50% Fibonacci retracement level at 134.89.
Wednesday’s high fell just short of those levels and the 10-day SMA to make a peak of 134.55. It may offer resistance if it is tested on a rally.
A close above the 55-day SMA could signal a return to bullish momentum, it is currently at 134.06. Further confirmation of such momentum may occur if the 10- and 21-day SMAs are reclaimed and if the gradients on these SMAs turn from negative to positive.
Underlying bullish momentum appears to be intact, with the price unable to go below the 100-day SMA on the recent sell-off and it’s gradient remaining positive.
The 2-month low made on Tuesday at 130.50 went below 2 break points and a previous low. The price closed back above these levels and could indicate a rejection of the extension lower.
Support might remain at those levels in the 131.25 – 131.50 area as well as the low of 130.50. Further up, support may lie at the break point of 133.19.
USD/JPY CHART
--- Written by Daniel McCarthy, Strategist for DailyFX.com
To contact Daniel, use the comments section below or @DanMcCathyFX on Twitter


