


Japanese Yen, USD/JPY, US Dollar, EUR/JPY, Euro - Talking Points
- USD/JPY makes historic high but might have a pause
- EUR/JPY appears to have set up for some range trading
- If the Yen weakening trend resumes, will USD/JPY take EUR/JPY north?
Introduction to Technical Analysis
Learn Technical Analysis
Recommended by Daniel McCarthy
USD/JPY
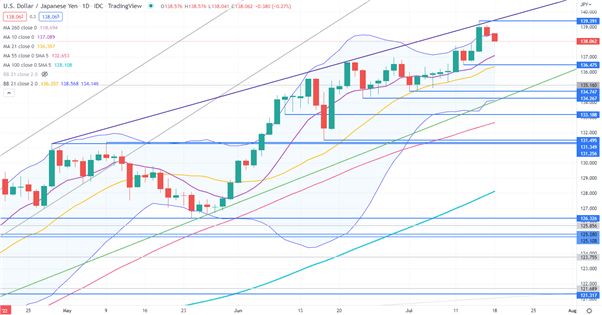
USD/JPY continues to press higher, making a fresh 24-year high last week at 139.39. The trend of higher highs and higher lows continues, and the price has bumped up against an ascending trend line.
With the price above all short, medium and long term simple moving averages (SMA), bullish momentum appears to remain intact for now. Supporting this perspective is the positive gradients of all SMAs.
A potential headwind could be the price action around the 21-day simple moving average (SMA) based Bollinger Band. The peak on Thursday moved above the upper band and it has closed outside it. It has since closed back inside the band, which might indicate a pause in bullishness and possibly a near term reversal.
Support might be provided at the recent lows of 136.48, 134.75 and 134.27, or further below at a potential support zone of 131.25 - 131.50, where there are two break points and a previous low.
Resistance could be at that recent peak of 139.39 or the ascending trend line, currently at 139.50.

EUR/JPY
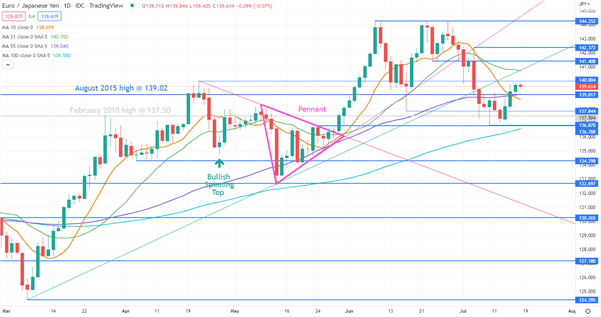
After breaking the topside of a Pennant Formation at the end of May, EUR/JPY went on to make a 7-year high at 144.25 in quick step.
Since that breakout, it has been in a 136.87 – 144.25 range. The lack of directional momentum is illustrated by the differing gradients of different time period simple moving averages (SMA).
The peak at the start of June has since been tested a number of times, but it has not been overcome and it may continue to offer resistance. Below that, the break points of 141.40 and 142.37 could offer resistance.
On the downside, the recent low pulled up just shy of a break point at 136.79 and the area of 136.79 – 136.87 might provide a support zone. The 100-day SMA lies just below there, currently at 136.58.
Introduction to Technical Analysis
Candlestick Patterns
Recommended by Daniel McCarthy
--- Written by Daniel McCarthy, Strategist for DailyFX.com
To contact Daniel, use the comments section below or @DanMcCathyFX on Twitter


